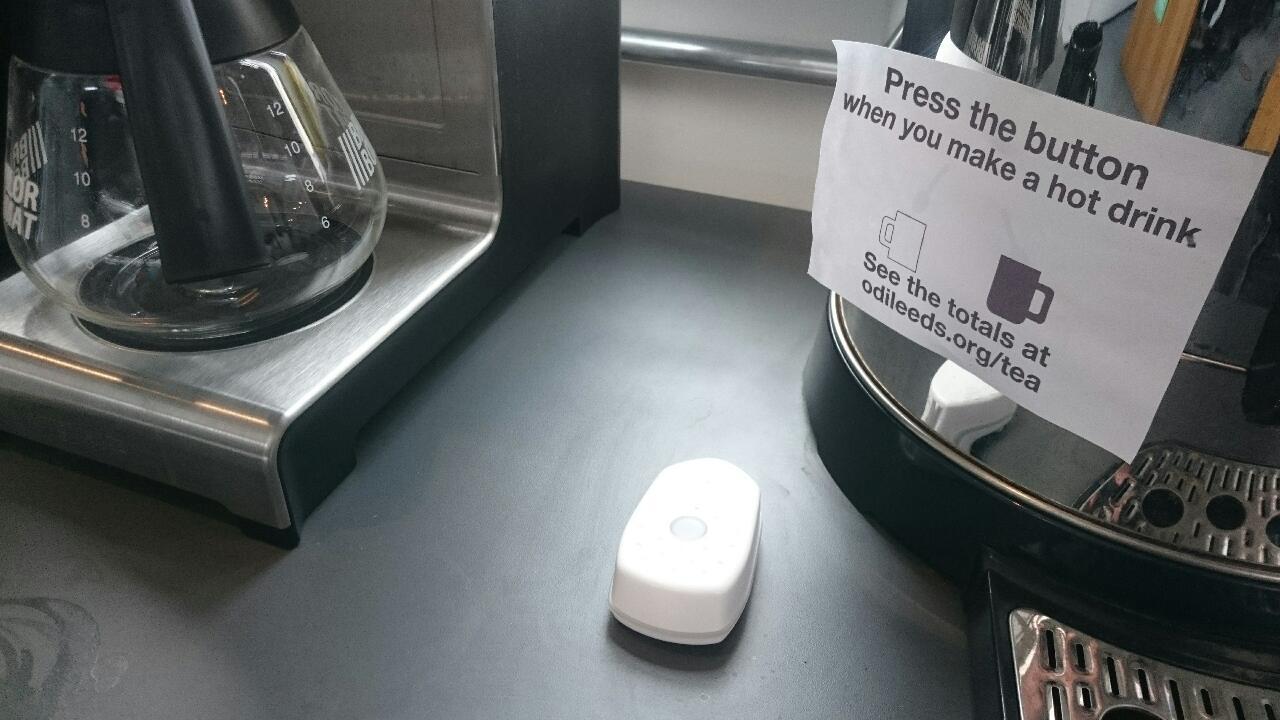
Here is a quick update about a more frivolous use-case of the Things Network that we started a couple of weeks ago when thinking of things to do with our Things Node. We decided to use the button to record each time we made a hot drinks in our space at ODI Leeds. The data feeds into a live visualisation of our tea and coffee consumption. As almost everyone who visits our space makes themselves a hot drink, the aim was to provide a simple, interactive, talking point that we could use as an excuse to chat about the Things Network and get people thinking about other uses. And so the Tea Totaller was born.
When the Things Node button is pressed it sends the temperature, light and battery levels along with the reason for the trigger (interval, button, accelerometer etc). We add a datestamp. We store all the resulting packets and generate some summary JSON files that then drive our visualisation. Aside from overall totals, the most obvious visualisation was a daily total graph. Then we added graphs that binned the data by month, by hour of day and - using the temperature sensor - by ambient temperature. Do we (and our co-workers) conform to British stereotypes of stopping for afternoon tea? Do we make more hot drinks when it is colder? As we collect the data we'll find out the answers.