Pellegrino
February 20, 2019, 4:03am
1
Hi!
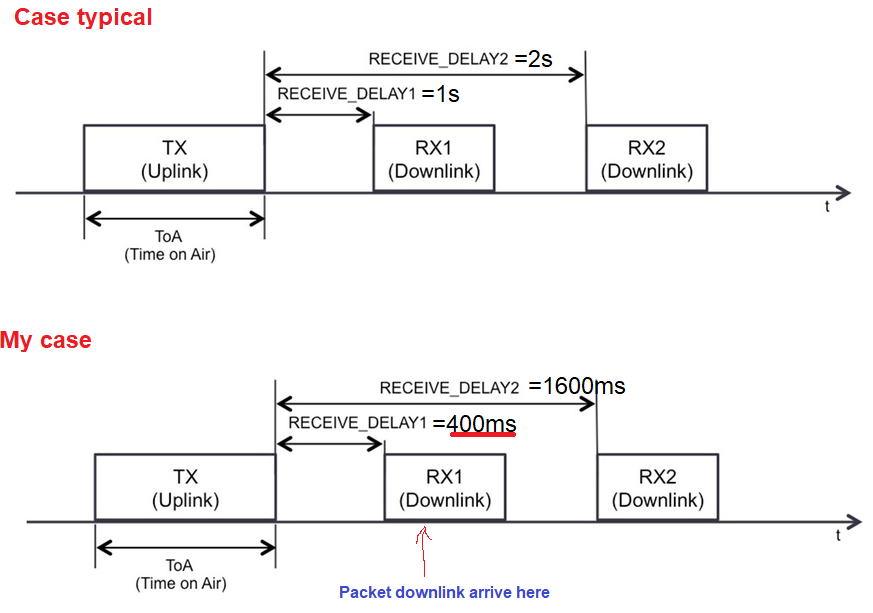
But in my end-node I open the RX1 window before and I can see than the downlink packet arrive 500ms after that uplink was send.
Any solution? Is the gateway? Is the server?
Thank!
1 Like
Pellegrino
February 20, 2019, 1:43pm
2
More details:
This picture show a regular case and my case (my configuration)
1 Like
Pellegrino
February 20, 2019, 3:57pm
3
This is the log of the gateway, now I use balenaCloud in the RPI3 but with “ttn-zh/ic880a-gateway” have the same behavior.
   20.02.19 15:41:40 (+0000)  main
    20.02.19 15:41:40 (+0000)  main  ##### 2019-02-20 15:41:40 GMT #####
    20.02.19 15:41:40 (+0000)  main  ### [UPSTREAM] ###
    20.02.19 15:41:40 (+0000)  main  # RF packets received by concentrator: 1
    20.02.19 15:41:40 (+0000)  main  # CRC_OK: 100.00%, CRC_FAIL: 0.00%, NO_CRC: 0.00%
    20.02.19 15:41:40 (+0000)  main  # RF packets forwarded: 1 (18 bytes)
    20.02.19 15:41:40 (+0000)  main  # PUSH_DATA datagrams sent: 0 (0 bytes)
    20.02.19 15:41:40 (+0000)  main  # PUSH_DATA acknowledged: 0.00%
    20.02.19 15:41:40 (+0000)  main  ### [DOWNSTREAM] ###
    20.02.19 15:41:40 (+0000)  main  # PULL_DATA sent: 0 (0.00% acknowledged)
    20.02.19 15:41:40 (+0000)  main  # PULL_RESP(onse) datagrams received: 0 (0 bytes)
    20.02.19 15:41:40 (+0000)  main  # RF packets sent to concentrator: 0 (0 bytes)
    20.02.19 15:41:40 (+0000)  main  # TX errors: 0
    20.02.19 15:41:40 (+0000)  main  ### BEACON IS DISABLED!
    20.02.19 15:41:40 (+0000)  main  ### [JIT] ###
    20.02.19 15:41:40 (+0000)  main  # INFO: JIT queue contains 0 packets.
    20.02.19 15:41:40 (+0000)  main  # INFO: JIT queue contains 0 beacons.
    20.02.19 15:41:40 (+0000)  main  ### [GPS] ###
    20.02.19 15:41:40 (+0000)  main  # No time keeping possible due to fake gps.
    20.02.19 15:41:40 (+0000)  main  # Manual GPS coordinates: latitude -32.96862, longitude -60.62432, altitude 0 m
    20.02.19 15:41:40 (+0000)  main  ### [PERFORMANCE] ###
    20.02.19 15:41:40 (+0000)  main  # Upstream radio packet quality: 100.00%.
    20.02.19 15:41:40 (+0000)  main  ### [ CONNECTIONS ] ###
    20.02.19 15:41:40 (+0000)  main  # bridge.brazil.thethings.network: Connected
    20.02.19 15:41:40 (+0000)  main  # Semtech status report send.
    20.02.19 15:41:40 (+0000)  main  ##### END #####
    20.02.19 15:41:40 (+0000)  main  15:41:40  INFO: [TTN] bridge.brazil.thethings.network RTT 103
    20.02.19 15:41:41 (+0000)  main  15:41:41  INFO: [TTN] send status success for bridge.brazil.thethings.network
    20.02.19 15:41:56 (+0000)  main  15:41:56  INFO: [up] TTN lora packet send to server "bridge.brazil.thethings.network"
    20.02.19 15:41:56 (+0000)  main  15:41:56  INFO: [down] TTN received downlink with payload
    20.02.19 15:41:56 (+0000)  main  15:41:56  INFO: [TTN] downlink 14 bytes
    20.02.19 15:41:56 (+0000)  main  INFO: tx_start_delay=1497 (1497.000000) - (1497, bw_delay=0.000000, notch_delay=0.000000)
    20.02.19 15:41:56 (+0000)  main  src/mp_pkt_fwd.c:1671:thread_jit(): lgw_send done: count_us=506044547
    20.02.19 15:42:11 (+0000)  main
    20.02.19 15:42:11 (+0000)  main  ##### 2019-02-20 15:42:11 GMT #####
    20.02.19 15:42:11 (+0000)  main  ### [UPSTREAM] ###
    20.02.19 15:42:11 (+0000)  main  # RF packets received by concentrator: 2
    20.02.19 15:42:11 (+0000)  main  # CRC_OK: 50.00%, CRC_FAIL: 50.00%, NO_CRC: 0.00%
    20.02.19 15:42:11 (+0000)  main  # RF packets forwarded: 1 (18 bytes)
    20.02.19 15:42:11 (+0000)  main  # PUSH_DATA datagrams sent: 0 (0 bytes)
    20.02.19 15:42:11 (+0000)  main  # PUSH_DATA acknowledged: 0.00%
    20.02.19 15:42:11 (+0000)  main  ### [DOWNSTREAM] ###
    20.02.19 15:42:11 (+0000)  main  # PULL_DATA sent: 0 (0.00% acknowledged)
    20.02.19 15:42:11 (+0000)  main  # PULL_RESP(onse) datagrams received: 0 (0 bytes)
    20.02.19 15:42:11 (+0000)  main  # RF packets sent to concentrator: 1 (0 bytes)
    20.02.19 15:42:11 (+0000)  main  # TX errors: 0
    20.02.19 15:42:11 (+0000)  main  # TX rejected (collision packet): 0.00% (req:1, rej:0)
    20.02.19 15:42:11 (+0000)  main  # TX rejected (collision beacon): 0.00% (req:1, rej:0)
    20.02.19 15:42:11 (+0000)  main  # TX rejected (too late): 0.00% (req:1, rej:0)
    20.02.19 15:42:11 (+0000)  main  # TX rejected (too early): 0.00% (req:1, rej:0)
    20.02.19 15:42:11 (+0000)  main  ### BEACON IS DISABLED!
    20.02.19 15:42:11 (+0000)  main  ### [JIT] ###
    20.02.19 15:42:11 (+0000)  main  # INFO: JIT queue contains 0 packets.
    20.02.19 15:42:11 (+0000)  main  # INFO: JIT queue contains 0 beacons.
    20.02.19 15:42:11 (+0000)  main  ### [GPS] ###
    20.02.19 15:42:11 (+0000)  main  # No time keeping possible due to fake gps.
    20.02.19 15:42:11 (+0000)  main  # Manual GPS coordinates: latitude -32.96862, longitude -60.62432, altitude 0 m
    20.02.19 15:42:11 (+0000)  main  ### [PERFORMANCE] ###
    20.02.19 15:42:11 (+0000)  main  # Upstream radio packet quality: 50.00%.
    20.02.19 15:42:11 (+0000)  main  ### [ CONNECTIONS ] ###
    20.02.19 15:42:11 (+0000)  main  # bridge.brazil.thethings.network: Connected
    20.02.19 15:42:11 (+0000)  main  # Semtech status report send.
    20.02.19 15:42:11 (+0000)  main  ##### END #####
    20.02.19 15:42:11 (+0000)  main  15:42:11  INFO: [TTN] bridge.brazil.thethings.network RTT 89
    20.02.19 15:42:11 (+0000)  main  15:42:11  INFO: [TTN] send status success for bridge.brazil.thethings.network
    20.02.19 15:42:26 (+0000)  main  15:42:26  INFO: [up] TTN lora packet send to server "bridge.brazil.thethings.network"
    20.02.19 15:42:33 (+0000)  main  15:42:33  INFO: Disabling GPS mode for concentrator's counter...
    20.02.19 15:42:33 (+0000)  main  15:42:33  INFO: host/sx1301 time offset=(1550676810s:945655µs) - drift=10µs
    20.02.19 15:42:33 (+0000)  main  15:42:33  INFO: Enabling GPS mode for concentrator's counter.
    20.02.19 15:42:33 (+0000)  main
And the node is a RFM95W with frdm-kl46z and its clock I supouce than is ok, because the duticycle work fine.
1 Like
arjanvanb
February 20, 2019, 4:14pm
5
The following is the relevant part, but unfortunately this is not specific enough to tell what TTN told the gateway to do, nor what the gateway did. Any chance you can set the logging to be more verbose? Or maybe the metadata in TTN Console, for both the uplink and the downlink, can help. (When clicking them in the gateway’s Traffic page in TTN Console.)
Pellegrino:
15:41:56 INFO: [up] TTN lora packet send to server "bridge.brazil.thethings.network"
15:41:56 INFO: [down] TTN received downlink with payload
15:41:56 INFO: [TTN] downlink 14 bytes
15:41:56 INFO: tx_start_delay=1497 (1497.000000) - (1497, bw_delay=0.000000, notch_delay=0.000000)
15:41:56 src/mp_pkt_fwd.c:1671:thread_jit(): lgw_send done: count_us=506044547
Pellegrino
February 20, 2019, 4:43pm
6
Metadata uplink:
 {
      "time": "2019-02-20T16:39:00.031260341Z",
      "frequency": 917.2,
      "modulation": "LORA",
      "data_rate": "SF7BW125",
      "coding_rate": "4/5",
      "gateways": [
        {
          "gtw_id": "rak831-balena",
          "gtw_trusted": true,
          "timestamp": 3928847795,
          "time": "2019-02-20T16:38:59Z",
          "channel": 2,
          "rssi": -28,
          "snr": 6.5,
          "latitude": -xxxxxx,
          "longitude": -xxxxxx
        }
      ]
    }
Metadata downlink doesn’t have. It is normal???
Pellegrino
February 20, 2019, 4:46pm
7
Hi @BoRRoZ !
The node-end spi speed in baudRate_Bps = 500000.
And the gateway I don’t know!
BoRRoZ
February 20, 2019, 4:46pm
8
Pellegrino:
“rssi”: -28, “snr”: 6.5,
is your node less then 10 meters away from your gw ?
arjanvanb
February 20, 2019, 5:00pm
9
The metadata you’ve shown for the uplink seems to be taken from the application/device’s Data page, not from the gateway’s Traffic page? Maybe the gateway’s Traffic page shows details for the downlink too?
But then: I assume the (relative) timestamp for the downlink is really 1,000,000 microseconds (so: 1 second) after the "timestamp": 3928847795 from the uplink. Some more verbose logging from the gateway itself is probably still needed.
(Ah, I think the gateway’s Traffic page does not show those details.)
Bummer, TTN Console does not provide information about the relative timestamp that it wants a gateway to transmit a downlink on.
Pellegrino
February 20, 2019, 5:15pm
10
Yes, but now I separeted 12m and the problem is still.
Metadata uplink:
{
  "time": "2019-02-20T17:13:43.305388484Z",
  "frequency": 917.2,
  "modulation": "LORA",
  "data_rate": "SF7BW125",
  "coding_rate": "4/5",
  "gateways": [
    {
      "gtw_id": "rak831-balena",
      "gtw_trusted": true,
      "timestamp": 754713955,
      "time": "2019-02-20T17:13:43Z",
      "channel": 2,
      "rssi": -69,
      "snr": 7,
      "latitude": -32.968616,
      "longitude": -60.62432
    }
  ]
}
When more I have to separate them?
Pellegrino
February 20, 2019, 6:01pm
11
Other question, who administers receive_delay1? The gateway or the server?
In other words, who count the receive_delay1? (1 second of wait)
arjanvanb
February 20, 2019, 6:07pm
12
The gateway tells the server about its relative time, "timestamp": 3928847795 in the log above. Next, TTN tells the gateway when to send the downlink, by giving a new relative time. For a regular downlink in RX1, it would add 1,000,000 microseconds and tell the gateway to transmit at 3,929,847,795. Likewise, it would add 2 seconds for RX2. For a Join Accept, it would add 5 seconds for RX1, or 6 for RX2.
So, the gateway needs an accurate clock as well. (It does not need to know the real time, a.k.a. wall time, but still needs an accurate clock.) You could compare the values of "timestamp" against the time between two uplinks. (Like if some uplinks are 20 seconds apart, then their timestamps should show a 20,000,000 microseconds difference.)
That’s why a debug log of the gateway will be very helpful, to tell what commands the gateway gets.
1 Like
I have fixed this problem!
The problem was my debug node. When I ran the program in my node MCU (in debug mode), the timing don’t work fine.
Thank ALL!!!
1 Like
system
May 4, 2019, 4:34pm
14
This topic was automatically closed 60 days after the last reply. New replies are no longer allowed.