Hello, I would really appreciate assistance with this issue.
I am trying to connect a board that I have (SAM R34 Xplained) over OTAA.
The board sends lots of join requests, using and they seem to be approved.
However, The board’s serial output shows: Device Activation
Join Request sent to the network server…
Join Denied
Try to join again …
Device Activation
Join Request sent to the network server…
Join Denied
Try to join again …
Device Activation
Join Request sent to the network server…
Join Denied
Try to join again …
Device Activation
Join Request sent to the network server…
Join Denied
Try to join again …
So, about the setup,
It is using JPN923 as the connect frequency, I am using TTOG and It works with other JPN923 devices.
This is in the code, I am wondering if the APP_PORT may be incorrect: #define DEMO_CONF_DEFAULT_APP_SLEEP_TIME_MS 60000 // Sleep duration in ms #define JOIN_REQUEST_LED_TIMEOUT 500 #define JOIN_ACCEPT_LED_TIMEOUT 1000 #define PERIODIC_UPLINK_TIMEOUT 60000 #define SUBBAND 2 // TTN use sub band #2 #define APP_PORT 1 // LoRaWAN Application Port
I know this is lite on info, I don’t really know where to go from here myself. Is there anything that can be done to debug or at very least put me on the right path?
If there is any more info, or if it would be helpful for me to expand any of the items from the console Just let me know!
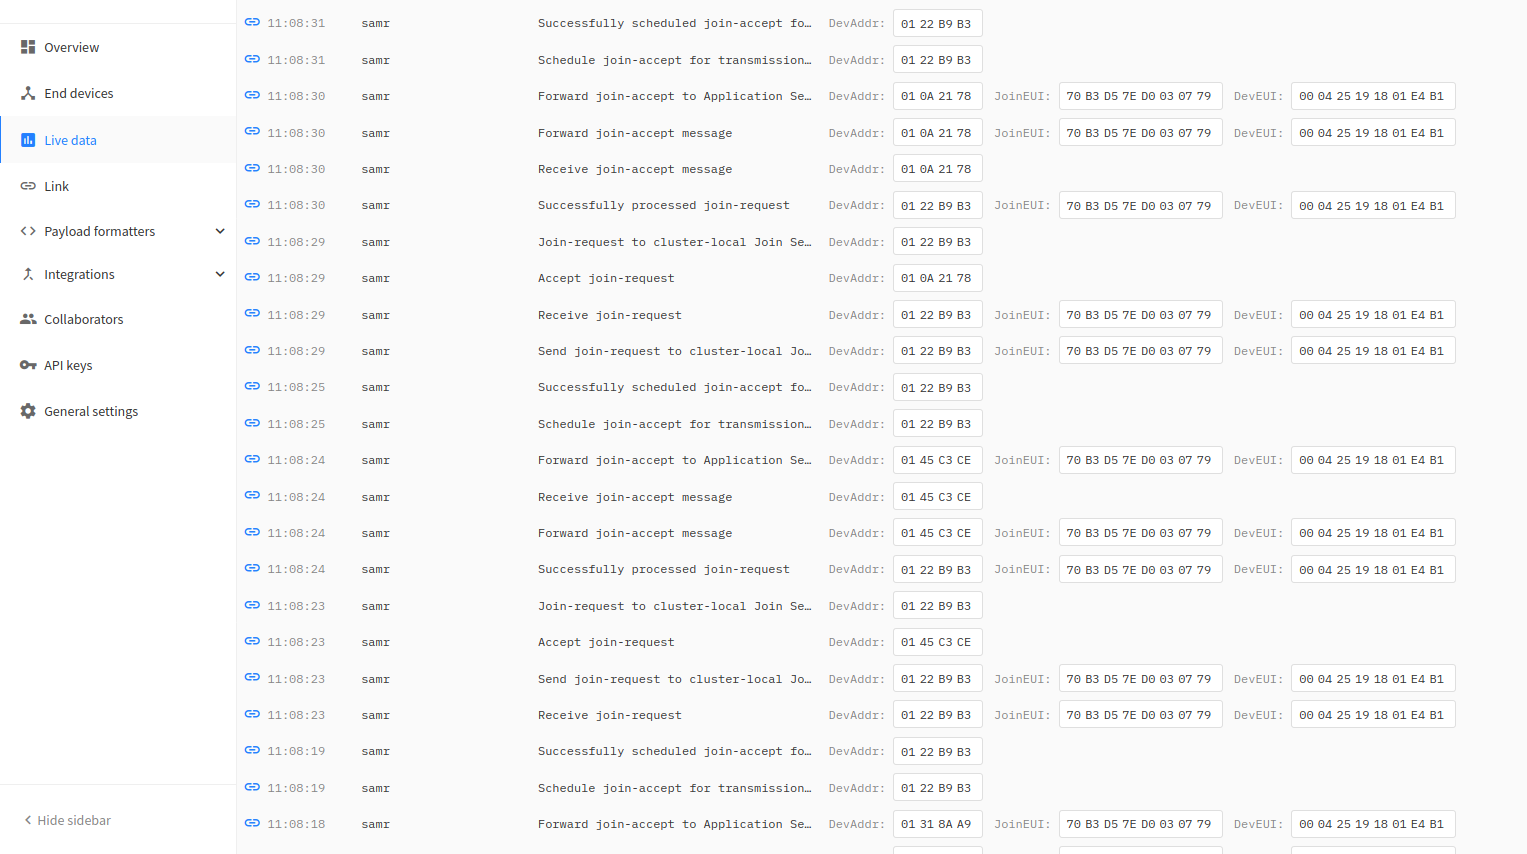
It would be useful to check the log of the gateway to see if and at what time and frequency the accept is transmitted. Should be 5 or 6 seconds after the request is received.
I got these from the Log item in TTOG’s Packet Forward Tab:
JSON down: {"txpk":{"imme":false,"tmst":1655210132,"freq":923.4,"rfch":0,"powe":13,"modu":"LORA","datr":"SF10BW125","codr":"4/5","ipol":true,"size":33,"ncrc":true,"data":"IDsma

INFO: [down] PULL_RESP received  - token[0:208] :)

WARNING: [gps] could not get GPS time from GPS

INFO: [down] PULL_ACK received in 29 ms

WARNING: [gps] could not get GPS time from GPS

INFO: [up] PUSH_ACK received in 44 ms

JSON up: {"rxpk":[{"tmst":1650210132,"chan":1,"rfch":0,"freq":923.400000,"stat":1,"modu":"LORA","datr":"SF10BW125","codr":"4/5","lsnr":11.0,"lsnr_min":8.8,"lsnr_max":15.5,"rssi":-79,"size":23,"data":"AHkHA9B+1bNwseQBGBklBAA0OL+xkQA="}]}


INFO: Received pkt from mote: D0030779 (fcnt=46037)
I am not sure if this is helpful. I do see a bunch of GPS errors, I hope this sin’t talking about that.
I see SF10BW125, after searching for that, I found TTN page about frequency plans. I see something about it being on freq 923.2 - SF10BW125 (RX2) for downlink? but mine is 923.400000? Am I on the right track here?
The frequency used for downlink is correct for RX1. If you look at the downlink timestamp you can calculate the transmission is 5 seconds after the uplink which matches RX1.
Can you enable more debugging at the node to check it is listening at the right moment using the right frequency and spreading factor?
Sub Band: 2
Data Rate: 3
DevEui: 000425191801e4b1
AppEui: 70b3d57ed0030779
AppKey: b911945d66cd1359fd2a3e9ada3a8ce4
DevType: CLASS A
And oddly enough, I have another project that I copied this code from, but that other project makes this very same board connect just fine. This really has me confused…