One problem working with LPWAN is having confidence that the antenna you just bought is effective. From my experience, it is not reasonable to expect similar-looking antennae to be equally efficient, or even tuned for the same frequency band.
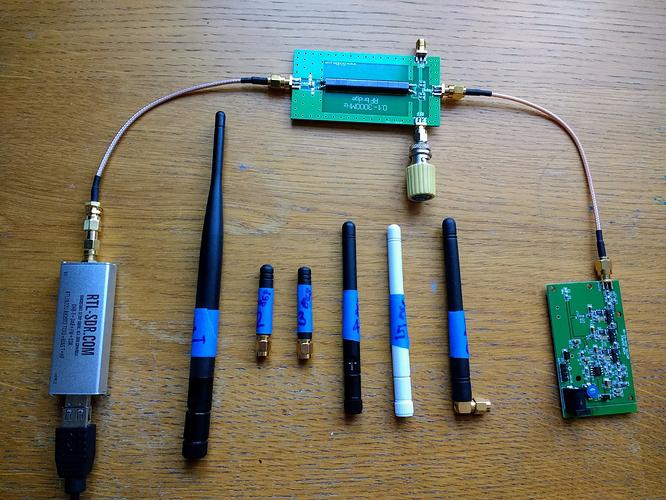
I decided to make a quick comparison of 6 antennae I had acquired over time from various suppliers. The method shown below is intended to simply identify the resonant frequency(ies) of each. The idea of the test rig is that the RF bridge enables matched connection of a white noise source, receiver (RTL-SDR) and the antenna under test. The RTL-SDR scans a suitable frequency band and the signal strength is plotted against frequency. The picture shows the 6 samples numbered 1 to 6 from left to right.

I based this test on the following article: – https://www.rtl-sdr.com/rtl-sdr-tutorial-measuring-filter-characteristics-and-antenna-vswr-with-an-rtl-sdr-and-noise-source/
The RF bridge and noise source can be bought cheaply from ebay – as of posting, UK item numbers 232943112992 and 202335272932. The 50ohm terminator came from my parts bin, a relic from the days of ethernet over coax (10base2)…
The idea of the test is first to scan the the rig with no antenna connected. The 50ohm terminator ensures a matched circuit. I chose to scan from 50MHz to 1.5GHz in 1MHz steps and stored the signal strength for each step as the baseline column in a Google spreadsheet – please don’t try this in Excel as manipulating so many values in a single spreadsheet will grind to a halt on a Windows PC.
Now each antenna is attached in turn and the scan repeated, giving columns Antenna1 to Antenna6. Next, each frequency step’s baseline value is subtracted from each Antenna’s corresponding signal strength. This results in a lot of data that effectively indicates the resonant frequency(ies) of each antenna – as shown by the overlaid plots.
So, as an indication, it can be seen that Antenna1 (brown trace) is well-tuned for the European LoRaWAN band, whereas Antenna6 (pink trace) is pretty useless.

Note that this test cannot be used alone to determine best antenna, which would require real field trials, monitoring actual RSSI and SNR at a distance from an installed node/antenna. Resonant frequency, for example can be detuned by the node’s enclosure, mounting and/or large metal objects, such as batteries. An effective ground plane will dramatically improve both receive and transmission characteristics.
However, this test does give a quick comparison in the lab and can lead you to reduce the number of antennae used in field trials.