If no reply is received within the next ADR_ACK_DELAY uplinks (i.e., after a total of ADR_ACK_LIMIT + ADR_ACK_DELAY), the end-device MUST try to regain connectivity by first stepping up the transmit power to default power if possible then switching to the next lower data rate that provides a longer radio range. The end-device MUST further lower its data rate step by step every time ADR_ACK_DELAY is reached. Once the device has reached the lowest data rate, it MUST re-enable all default uplink frequency channels.
If your nodes are stationary enable adr, beware if you use the semtech lorawan stack there are some minor bugs that blocks the node to move from sf12.
hi
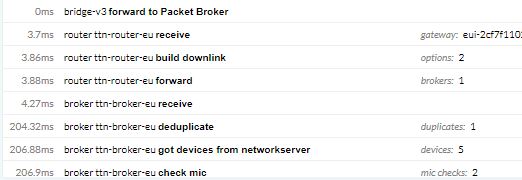
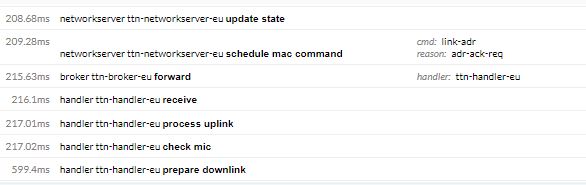
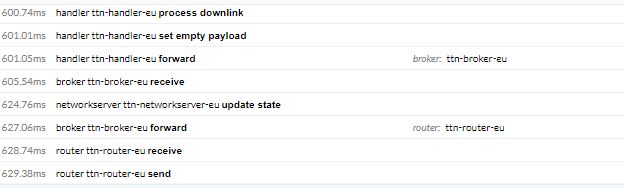
Today I tried using sf12 for uplink and based on the log on my gateway side after an uplink there was a downlink on sf9 and the reason was optimizing
means nodes should switch to higher data rate but this did not happen and regarding all downlinks my node did not change the sf from 12 to lower sf
what would be the problem?
I have enabaled adr
thank you for the reply,
I am using v2 and I have tried for 12 uplinks which I did not see any changes in sf from 12 to lower ones,
after how many uplinks i can see the adr effect?
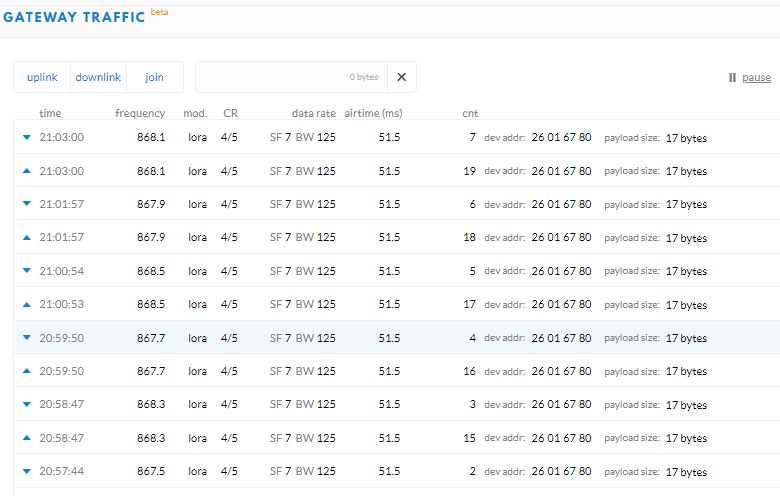
I have another problem when I use sf7 after 12 uplinks i got adr ack downlink for every uplink And as I have read from this forum this shows the problem but I could not find any answer regarding sovling this problem for the old lmic library by matt
Can you show the log info that shows these downlinks - preferably from the device, the gateway log and the gateway console - assuming you mean ADR Req (the downlink) and the devices lack of ADR Ack in its next uplink?
Then brighter minds than mine can look at the details for you.
about the adr effect , I have just tried for less than 1 packets and as you said I must try for more uplinks to see the result
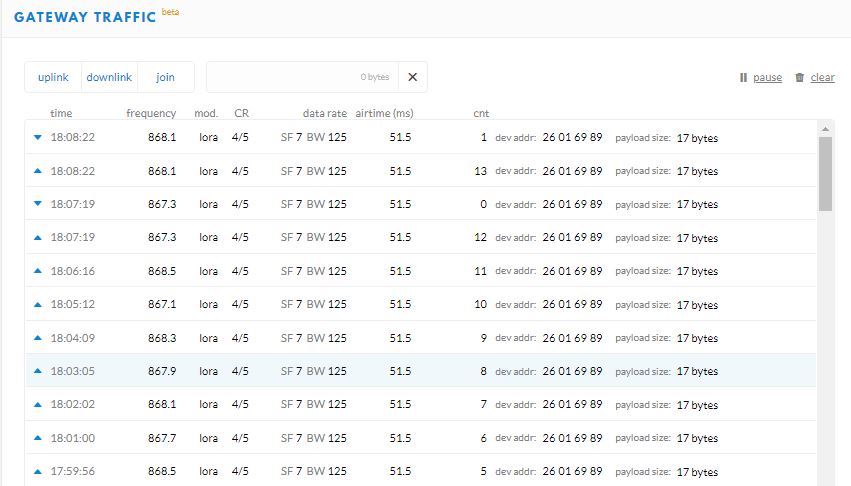
here is my gateway log when I tried SF12:
LoRa Alliance requires network providers to restrict SF11 & 12 so you are likely to get an immediate response if your link margin is ridiculously hight.
At some point you will be told that your uplinks are far far to frequent - put a push button on your device so you can send an uplink on demand rather than have it hammering out one every minute.
We can guess at some of the detail but if you want to debug this, you’ll need to capture the actual payloads / headers etc
thank you I will put a push button,
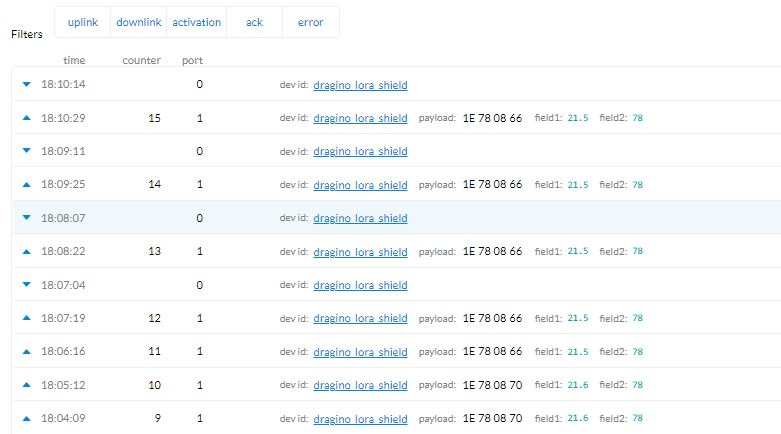
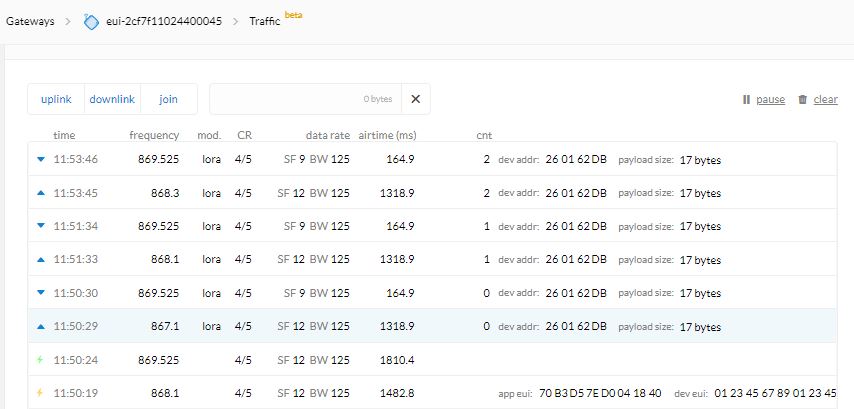
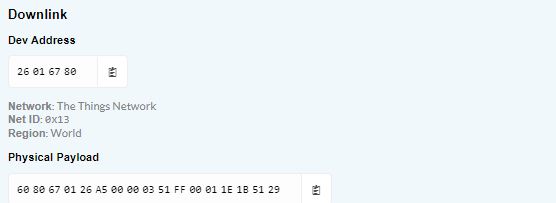
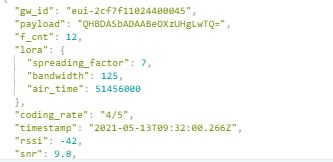
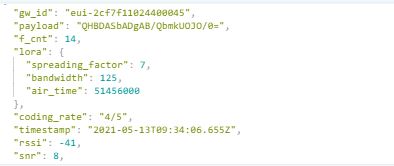
here is downlink payload from gateway side when i use SF7 and after 12 packets I receive this downlink after every uplink :
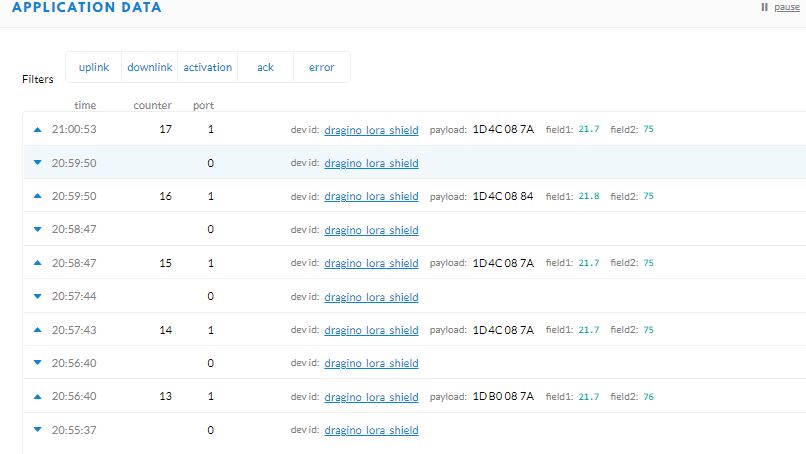
and from application side:
sorry for the late answer
these are uplink datas ,
honestly I do not know where i have to check the number of gateways which are seeing uplink messages
Look at the same sort of data on the application console for the uplink - it will show a list of all the gateways.
But now we see the rssi & snr, we can see that they are most likely in the same room, which isn’t good for the gateway BECAUSE IT IS EXACTLY LIKE SHOUTING IN THE EAR OF SOMEONE WITH VERY SENSITIVE HEARING.
And because the device may not be reducing power, you may have found a way to break the ADR algorithm.
Try something more akin to real life - like about 200m separation.
Or if you aren’t actually investigating ADR, just put 10m & a wall between the device & gateway.
I suspected that if seeing a very strong signal then the usual ~20 messages to trigger ADR may be curtailed - hence you seeing 12 (?) before MAC commands asking for change under ADR (on Port 0), hence my request for the data. I have some nodes with occasional -38-45 RSSI which behave ok but others around -40-48 which can be problematic. So suggest - as Nick recommends - you seperate (pref through say a wall as well as distance) to get RSSI down to a more real world ranng of -50-85 for testing and see what happens then…(200m gets to be a pain if regular/ready access during testing needed (especially if testing with British weather outside!) so a couple of walls or perhaps >30m open space should be a good start )
You could put the gateway further away - particularly if you are experimenting with ADR as you can use other walls to vary your signal strength.
Having a hack at a v3 instance to log each ADR calculation is within my range, perhaps something to play with when I run out of other things to do. Oh, wait …

 )
)