Your MQTT code works for me; if I make the Payload Format do
return 1/0;then, when simulating an uplink through the device in TTN Console, I get:Connected Uplink Errors Received uplink error from my-device-id { error: 'Unable to decode payload fields: Decoder not valid: does not return an object' }
It is also working for me, when simulating an uplink. But for real data I don’t get any uplink, downlink or activation errors. I don’t get anything.
Is there any way to find the reason why the message is not forwarded to the application? Is there a proper way to debug the data flow from the network server to the application? It keeps sending data to the gateway and I can see the device address is still the same with the one on the application.
Does the trace information in the Traffic page in TNN Console look something like the following?
And is the Payload Format still okay, like “Custom”?
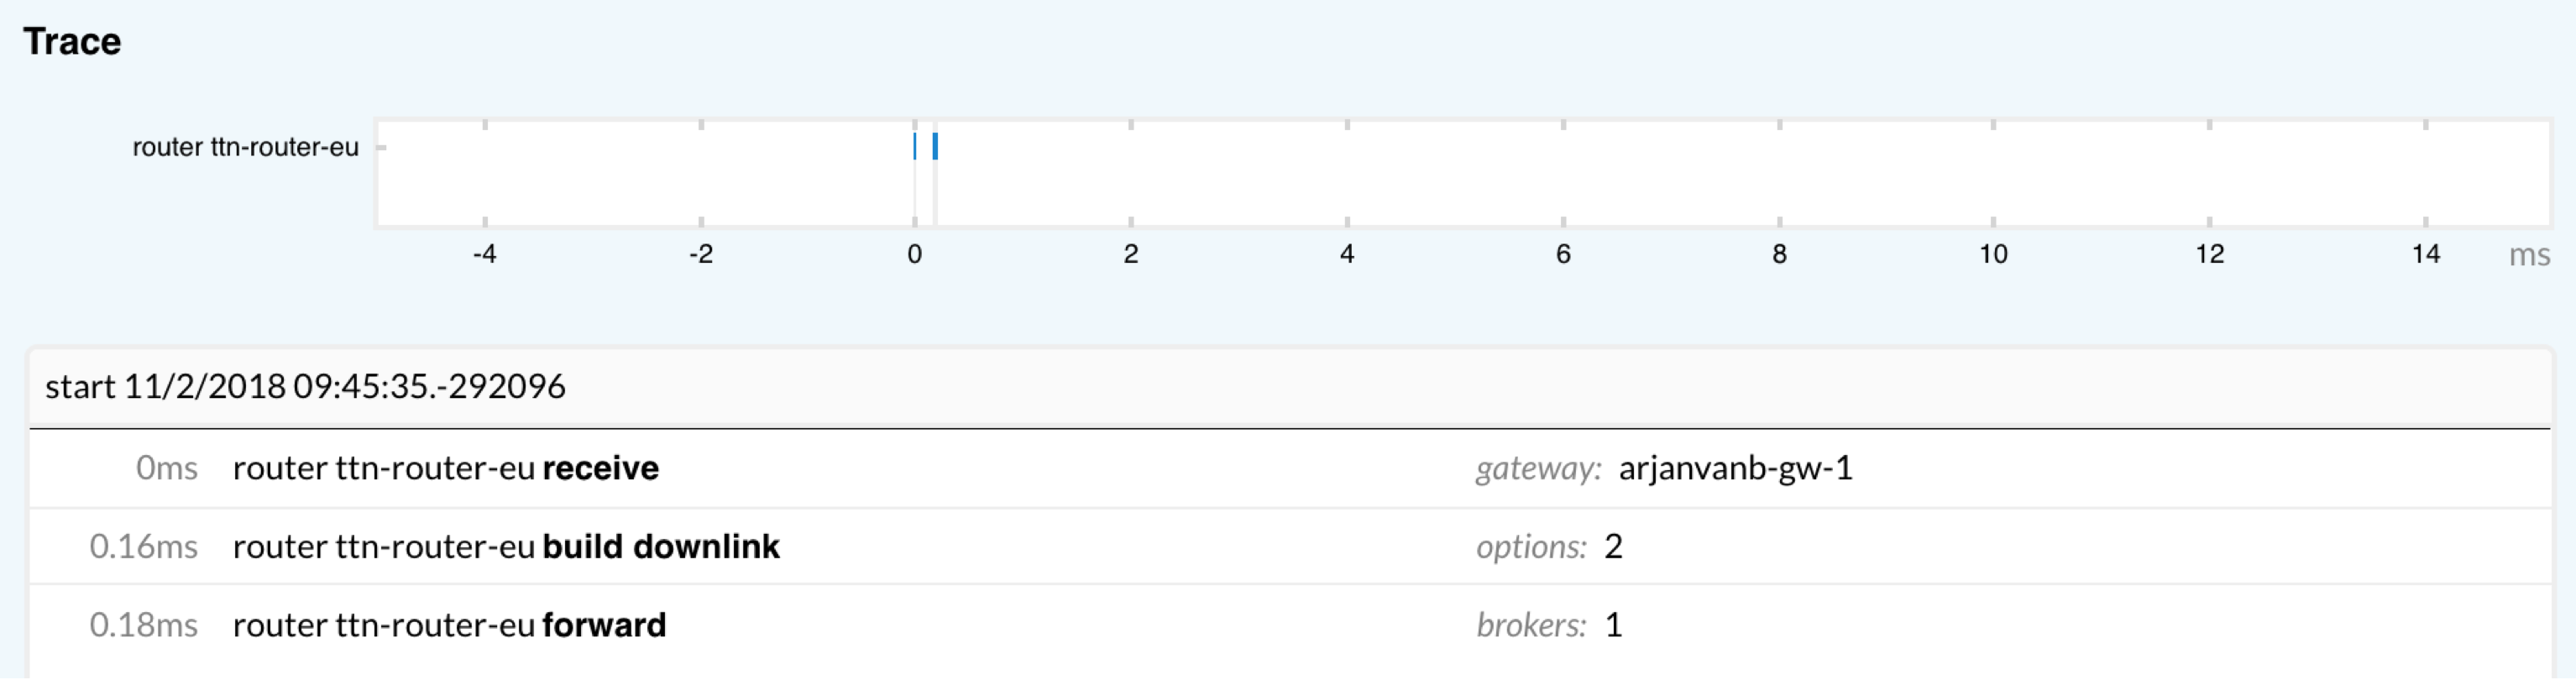
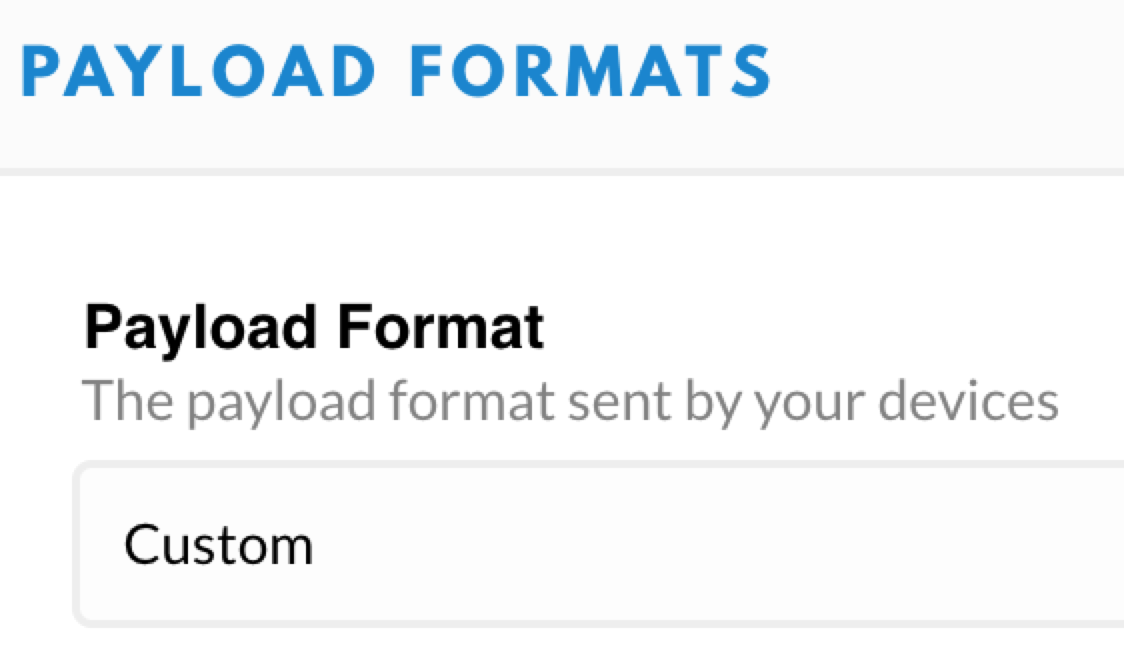
Exactly like that! I have also disabled the frame counter checks (last reply at https://www.thethingsnetwork.org/forum/t/data-received-by-the-gateway-but-not-on-application/16145/8) but that did not make a difference. The device looks dead on the application console.
Just wondering if and how is possible to find the error log. The subscription to the MQTT API error events does not give any results. The data seem not be forwarded at all to the application for some reason.
Once again, thank you for your help!