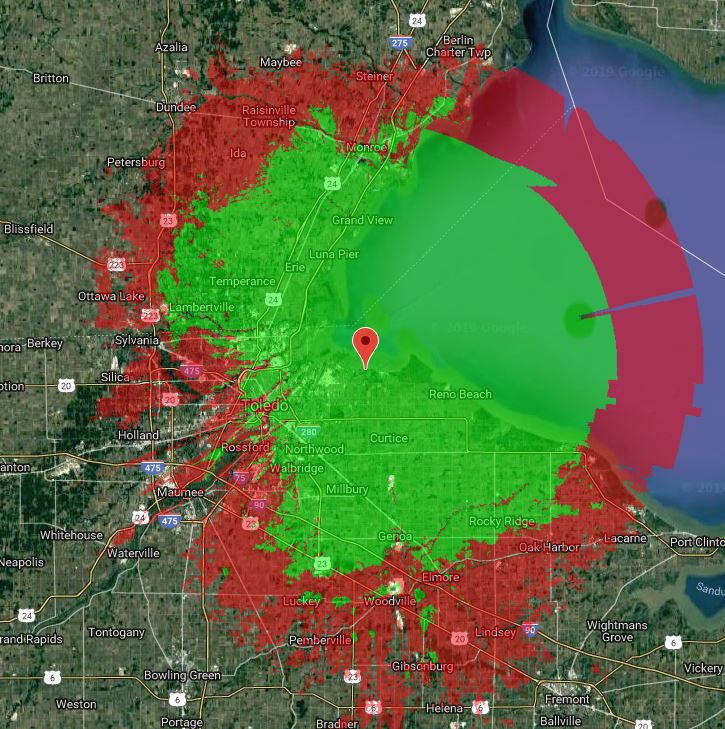
What tools are folks using to plan gateway installation and coverage maps? I just stumbled across https://towercoverage.com, which seems pretty cool… Here’s a processed coverage map for a LoRa gateway with an antenna at 50m. i’m not quite sure im using the right specs… but it seems right… green is rssi < -130
You can also use Roger Coudeé’s fantastic site at http://www.ve2dbe.com/rmonline.html to do very similar plots for free! Towercoverage has a rather short trial period.
I have used both ve2dbe and CloudRF web sites for coverage modelling and have also done a lot of “walk-test” surveys in 2 types of locations - Scottish post-glacial hilly terrain and on offshore oil facilities - to confirm coverage. I also post-process a lot of uplinks received on my TTN gateways and applications looking at real RF performance.
The @everhamme RX sensitivity figure of -133dBm is about right for SF 10, 11 and 12 per published information.
However… I see 2 types of departure from the -133dBm and RF coverage models in reality:
First, the real sensitivity at SF 10, 11 and 12. This is -15, -17.5 and -20 dB to the noise floor. To receive SF12 at -133 dBm would require a noise floor of -113 dBm. The noise floor in all outdoor locations I check is more like -100 to -105 (and much much noisier, like -90, below-decks in oil-rig machinery spaces). In reality I almost never receive any SF12 uplink with an RSSI below -120 dBm.
Second, the signal propagation at SF 10, 11 and 12 is going way beyond line-of-sight in hilly country. The LoRa signal is clearly benefiting from multipath transmission via refraction, diffraction and scattering. For most radio transmission with high symbol rates, multipath is a problem because it causes inter-symbol interference. For LoRa with very low symbol rates, multipath is a benefit. This generally means that many RF coverage modelling systems under-estimate the coverage available at SF 10, 11 and 12 in hilly country.
@cultsdotelecomatgmai I have a strong suspicion that terms and phenomenas are mixed up in your story.
There are two main phenomena’s in radio propagation that influence a signal.
Slow fading or lognormal fading
fast fading or raleigh fading.
slow fading is dominant in rural areas where buldings are scarce and the radio signal is only affected by terrain curvature. fast fading is the result of multipath propagation where a radio signal is receiveived. Thes different paths are produced by scarreting against buildings. This type of fading is dominant in urban areas weher there are a lot of buildings.
With respect to the noise floor it is important to know where it was measured. As in LoRaWAN uplink is dominant, the noisefloor is likely to be measured at the gateway and not on the downlink at the node. I am curios to know how you measured local noisefloor.
I would agree, and its what I have found to be the case in practical real world tests.
A noise floor figure of -100dBm to -105dBm plus the rated SNR for the spreading factor used gives a signal strength that is very close to the actual real world link failure point, and its quite different to the data sheet quoted sensitivity.
@cultsdotelecomatgmai Can you teil me about your survey setup? Did you collect the measurements while driving? Or static?
It is important to know that the receiver sensitivity specifications are given for static operation and not for moving mobiles. therefore a one on one comparison is not applicable between measurements with moving mobiles and static receiver sensitivity specifications.
Out of interest I evaluated the RF propagation tool on this site was surprised how close it is to actual experience. I adjusted receiver sensitivity to -120dbm, and Tx power to 1mW.
Cluttered Urban Environment
Comparing the Propagation Tool with experience from TTN-Mapper, it was correctly predicted
the limited (close in) range in an urban environment
reception in elevated locations
reception in a number of distant locations where I would not expect reception but was surprised TTN-Mapper had recorded receiving packets.
Rural Environment
I then tested it rural location (flat ground) where I have 12 nodes and the regularly measured RSSI level aligns with the prediction.
I used the following.
Antenna Height = 7m above ground
Tx Frequency = 920MHz
Tx Power = 1 watt = 30dBm
Tx Line Loss = 3dB
Rx threshold = 0.2uV (-120dbm)
Receive Reliability 70%
From experience I don’t see Rx levels below -120dBm and I’m in Au where Tx levels can be 30dBm. I usually back off the Tx power and use a higher gain antenna (to improve Rx performance).
This was surprising close to real experience and by the way, in two separate sites.
Hi @pe1mew, we install LoRaWAN gateways and sensors on farms for agri-tech. Some of the gateways are on farm-buildings.
When we survey the gateway sites we leave an RF spectrum analyser on the site for 48hrs to look for possible intermittent interference from heavy machinery, pumps, etc. and - potentially much worse - from UHF RFID readers which are becoming much more common on farms. As a side-matter we see the average noise floor. A UHF RFID interrogator in Europe (ETSI 302 208) can render LoRaWAN in Europe channel 5 (867.5MHz centre freq.) unusable but some RFID systems can be configured not to use this channel.
When we walk-test it is just that, a slow walk. A pycom lopy4 sending an uplink at SF12 once every 2 minutes (yes I know it breaks the TTN FUP, please forgive me, but not the ETSI duty-cycle regulations). The 2dBi dipole antenna is on a pole about 50cm above my head. The uplinks send the lat/lon and an incrementing count # and also stores the data locally on the lopy4. We store the MQTT feed from the core with metadata. After the walk-test (typically 10km over 3 hours) we can analyse the data. Predicted RF coverage and walk-test data are then merged on Google Earth for the customer.
I won’t discuss the horrors of the RF environment on offshore oil rigs because it’s such a niche.
I’m interested in the community-wide view of real-world uplink RX RSSI performance vs. datasheet. I would love to see a TTN big-data project to look at the real LoRaWAN uplink RX RSSI limits at the different SFs so that real numbers can be used in RF coverage planning.
I have found my limit is -120dbm and recently purchase a number of the RAK2245 (gateway) boards as they have dual SAW filters in the receiver chain. I’m interested to see if thus improves receiver performance. If not, nothing lost, but i’m hopeful it will get me one step closer to the theoretical performance of Lora.
At the LoRa settings in use, 3dBm was just enough to make the link work, it failed at 2dBm. The key part was this;
Following the 40km\2mW LoRa result, Howie DeFelice produced a link budget calculation
spreadsheet for the LoRa devices.
One anomaly that was clear from the results of Howie’s link budget calculation was that the signal
strength of a 2mW transmitter at 40km calculated as -114dBm.
As 3dBm\2mW was the proven limit of reception, you can conclude that the receiver needed at
least -114dBm of signal to reliably operate. However, the Semtech LoRa calculator application
claims the sensitivity at the bandwidth and spreading factor used was -131dBm, so where has the
missing 17dBm gone?
The sensitivity quoted in the data sheets is probably a figure that cannot be achieved, at least in
non-laboratory situations on Earth, since the real life background noise level is so high. I checked
and a typical background noise level reported by the SX1278 RSSI register during the 40km test
was around -100 to -105dBm. My RF Explorer spectrum analyser reports a similar level. With
noise at that level there may be little value to be gained by the LoRa receiver having a sensitivity
of up to -148dBm as the data sheet specifies.
Where the LoRa device seems to be is getting it’s real world performance from (it is clearly
substantially better than the FSK receiver in the RFM22B) is its ability to receive signals below the
noise level. The acceptable signal to noise ratio (SNR) for the spreading factor used in the 40km
test (8) is quoted in the Semtech data sheets as -10dB, so the receiver should work if the signal
was 10dB below the received noise level. 10dB below a noise level of -100dBm is -110dBm, close
to the predicted signal level that 40km\2mw would have produced (-114dBm).
So whilst the receiver predicted sensitivity (of -131dBm) might suggest far greater range than
2mW for 40km gives in reality, it’s the relationship between local noise level and SNR performance
that appears to predominate.
Thanks to everyone for the good discussion and to finally, and I hope properly, respond to @everhamme’s question of 2 days ago about how to set the RX sensitivity in RF coverage modelling software…
I plan to do the following for my rural LoRaWAN coverage work:
Assume a noise floor in the EU 868Mhz band at -100dBm.
Model/predict coverage for DR5/SF7 using RX sensitivity of -107dBm.
Model/Predict coverage for DR2/SF10 using RX sensitivity of -115dBm. Note: DR2/SF10 is the highest SF that LoRa Alliance regulations permit to be hard-coded without ADR on public networks.
Model/predict coverage for DR0/SF12 using RX sensitivity of -120dBm.
Do more sophisticated walk-testing at SF7, SF10 and SF12.
The main drivers for this in my work are battery lifetime and delivering reliable service to customers.
YMMV.
And as you suggest it would not be difficult to arrange a practical test, my idea would be;
At a location instead of a Gateway use a simple test transmitter that sends out test packets at the appropriate power and spreading factor.
Then take a matching simple receiver and in a few directions and travelling away from the TX check at the actual locations where reception ends.
Now use a planning tool to model the location and see what model parameters most closely match the reality.
I appreciate that people do the modelling and check RSSI readings by looking at the gateway log, but we know that the RSSI reported by the LoRa device is at best an ‘estimate’ that has changed substantially since LoRa came out, so I would not be assuming its in any way an accurate indication of the real signal level.
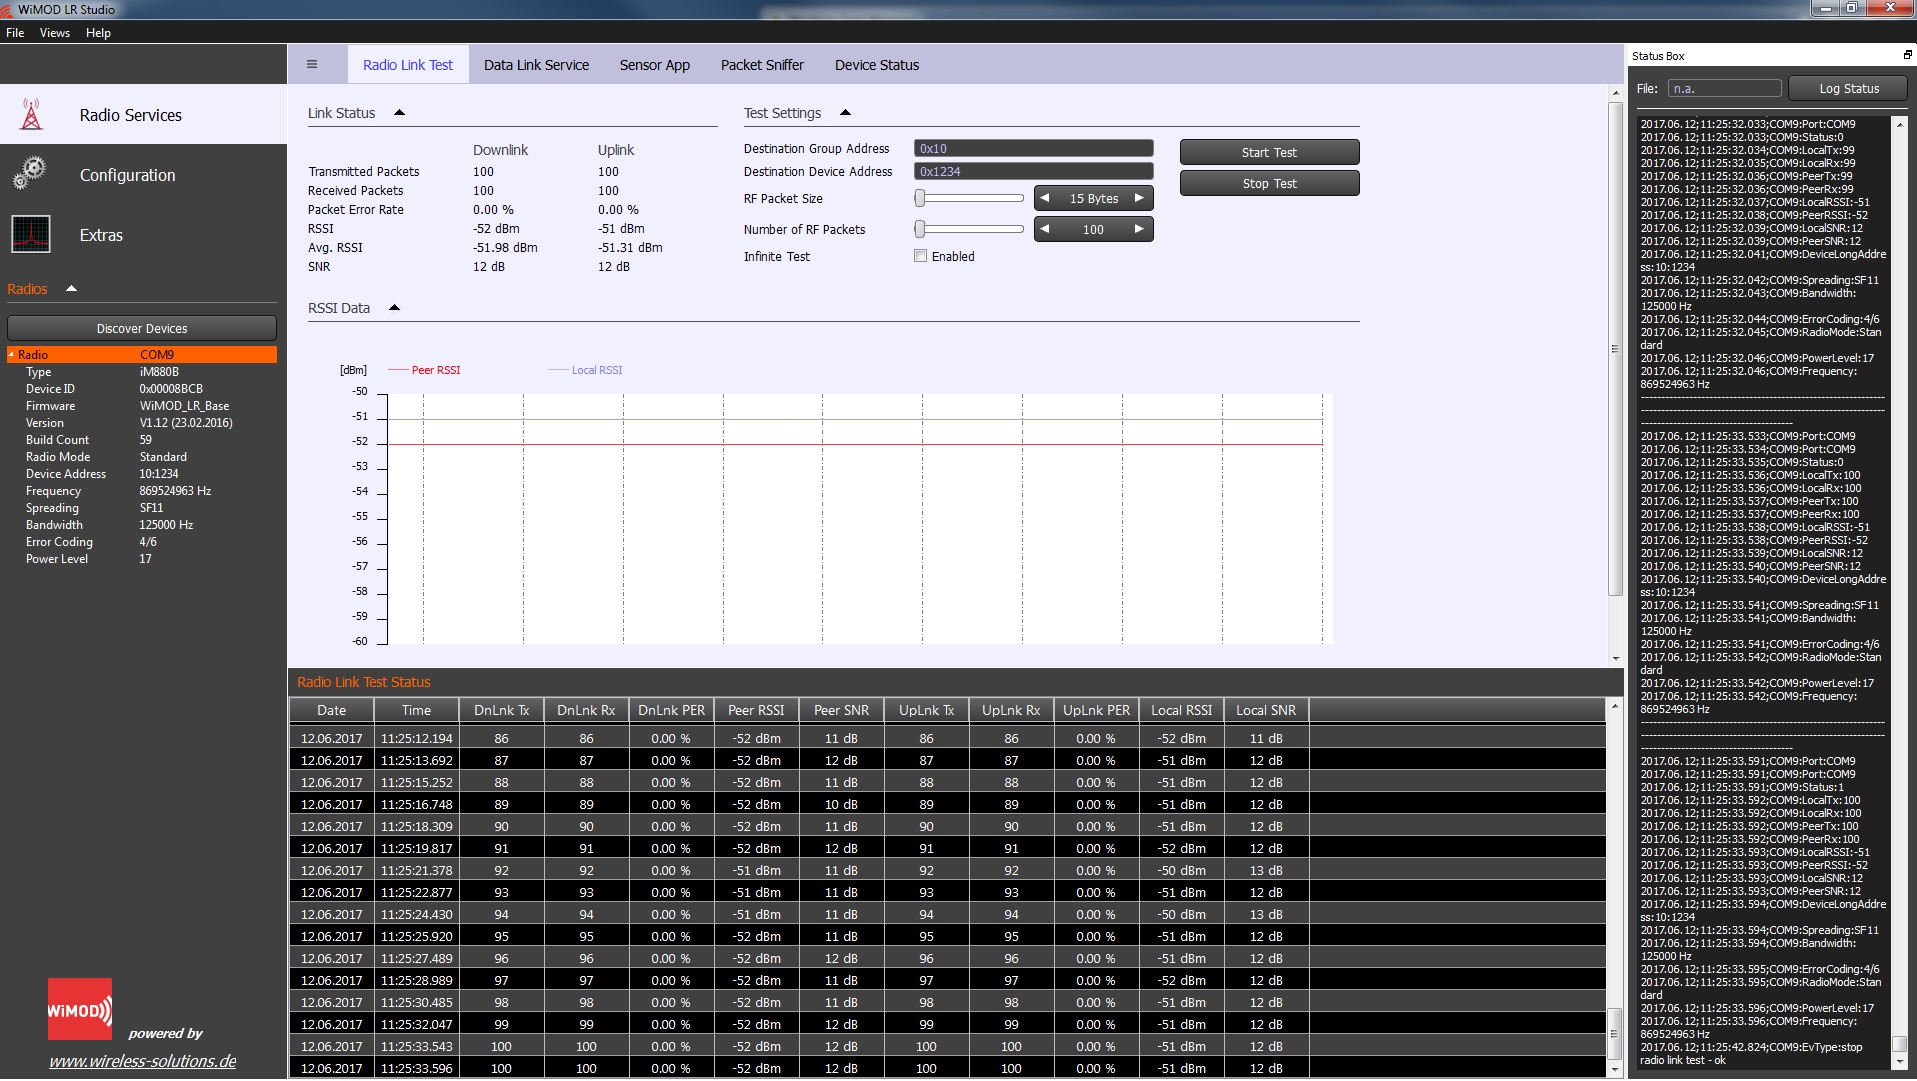
I have used IMST modules in the past on P2P LoRa for walk-testing as the IMST WiMOD console software has a very good radio link test capability and the remote node has a “LoRa ping responder” capability. This can be run in LBT/Polite channel access and so can run without the normal duty-cycle and TTN FUP restrictions.
The difficulty, for me anyway, is to get a test equipment setup up onto the roof of farm buildings with a big antenna, etc.
thanks all for the great conversation… i’m generally looking for a “rough” coverage map… i have also found the coverage tools to be very accurate… I know its much better to plan to use as little transmit power as possible to save battery… so these theoretical maxes are mostly for specs testing… -120db is probably a more realistic threshold.