Storing Gateway Console Data for analysis

Quick search of forums didnt show anything useful so new thread…

I am evaluating coverage vs not-spots in a small region (say 5x5km) targeting key sites and some general areas and find it useful to monitor the gateway console pages to see if a packet from any one of several known test nodes is picked up as they wander around or move placement deliberately in an area - allows me to determine location of not-spots vs hot-spots for optimisation or for future infill GW placement.

Assume I have 4 GW’s called North South East & West with partially overlapping coverage for a small degree of resilience. As the nodes move around I can check the GW Console data ‘live’ to see if sequenced numbered packets are received. If I see a gap in seq# on say North console I can quickly check the others to see if that sequence # captured…if it is then great I have near constant coverage as the data will still get to back end. If not, I check on the other two consoles in turn and if none captured that TX I know I have a potential not-spot and can either infill with another GW or I can iterate a given GW placement or possibly antenna height to try and re-establish coverage and improve/optimise as needed.

This is fine for quick live checking and I have another more detailed set-up capturing and storing some sensor GPS & other data plus the metadata that is captured and stored for later off-line examination of that one specific GW location (independent of N,S,E & W gateways) to build up sequence coverage and map GPS locations & tracks from where ever that one system is used.

My problem is the GW Console data I see is ‘transient’ in that I can see a reasonably long list until it gets truncated but then its gone. Also with say iPad if I switch been the browser tabs for each GW then any recent packets received (minutes) quickly update and I see full list to visually parse through for target Dev Addr and check for missing Seq#'s. On PC with FFox or IE behaviour is different in that if I go off tab for too long I get ‘Fatal Error’s’ and need to manually refresh page to update - loosing any prior data. On a different thread when I flagged this a forumite suggest Adblocking may be issue with respect to Pusher.com used by TTN backend but even though I have white listed behaviour continues and I loose ability to cross check across all the GW’s if i wait too long to look at any given console page.

So my question is - is there an easy/simple method of capturing & storing the traffic data for any given console so I can analyse and review offline - possibly even as audit or archive of captured coverage data to allow much later (3 months 6 month , years?) analysis and comparisons to see how coverage has changed over time - e.g. impact of a new tower block, new warehouse, new motorway bridge causing shadowing, seasonality or adverse extreme weather, etc.? I did consider something like Squix (Daniel) http integration push of application data to Google sheets:- https://blog.squix.org/2017/07/thethingsnetwork-how-to-use-google-spreadsheet-to-log-data.html but that needs application integration vs GW and I’m not much of a Softie to be able to hack an equivalent for GW - if even possible through that route - and indeed I am not interested in a given ‘test’ nodes apps data just ‘can I see it & how well?’ - so no need to decode payloads etc. hence appeal here.

For now a simple grab of the Dev Addr and Seq# is a good start to tell me if seen or not - ideally though would like to store the expanded info with timestamp, RSSI, SNR etc as seen in drop down for any listed received packet in the Console for more detailed off line analysis or comparisons.

Folks any good pointers?.. :thinking:

What hardware and packet forwarder are you using?

A mix - but all looks essentially the same once it gets to the Console right! ? :slight_smile:

I have various Laid, iMST Lite & TTN GW’s that will/are be called on for this effort, plus ‘self contained’ system is a SMTC IoT Starter Kit - but that isnt ‘integrated’ to Console and is ‘standalone’ doing exacly what I needed in this instance. There is also potential for several other types to be involved on these 1st coverage checks and for planned similar exercises in the future - multitech, kerlink, a couple of Pi’s + either 880a or RAK 831’s or Pi Zeros with…etc. For other future cases there may well be Link Labs, Evrynet or LoRix. Hence an ‘at the gateway’ solution (or solutions!) dismissed at too complex and not scalable but rather look at grabbing TTN Console data.

People have asked previously but no one found the answer yet (or at least we haven’t been told :slight_smile: ). However, the console uses javascript to get the data so you should probably be able to use a variation on that code (combined with node-js) to do the same.

1 Like

As the current Console is not open source (the V3 version will be), I guess that hooking into the API it uses is not future proof. So I guess it boils down to hoping for Monitoring traffic, etc. from my gateway per mqtt? (Non-existent either, but kersing’s MP forwarder provides a different approach.)

@kersing @arjanvanb Thanks for considering guys - was afraid that may be the case :frowning: was hoping there was a simple option/integration to ‘push this button and capture the next 3 hrs of traffic data for this gateway’! - tee hee :-):grin:

As for a non softie diving in and writing javascript, node-js etc…well…unlikely.

Wrt future proofing that is a future problem - am looking at solution for immediate and near term use (next couple of days through next couple of months) though for benefit of archival and long term coverage comparison will need to find later version if V3 etc. breaks any near term solution.

Will go away and have another re-think. :thinking:

Is setting up node-red with an influxdb and grafana for visualizing an option?
All the metadata that is captured with the packet can also be stored and visualized.

It is relatively easy to set up:

https://www.thethingsnetwork.org/labs/story/store-and-visualize-data-using-influxdb-and-grafana

2 Likes

Ah, indeed, @itbv is right: as in this use case you know the nodes, you can access the nodes’ meta data.

@itbv @arjanvanb Guys thanks I will take a look at that this afternoon/this evening :slight_smile: Does it make any difference that the nodes are not registered in applications in TTN - the gateways are just seeing traffic from the nodes and reporting ‘sightings’ accordingly. Indeed some of the nodes being monitored are even registered to other networks or use cases.

The nodes have to be registered in TTN to be able to capture the metadata in node-red. So in your case it won’t work.

that leaves local monitoring at the gateway by parsing the log etc. But then I think you’re right in concluding that that’s not scalable at all with so many different types of gateways.

As example, I am using RAK831 with Ubuntu and I simply changed a bit test programs to store payloads as characters in some file that I periodically read with python script for parsing and storing to db. It is a bit ‘hacky’, but it took me hour to make it and comparing it to time building TTN on ubuntu as standalone server this did the trick. :slight_smile:

1 Like

I wanted to store the Gateway data in my database, and could not wait till V3

It can be done from the Front-End but is a bit of a hack, because you need to keep THREE Chrome Browser windows open:

1. Open the TTN Gateway Console

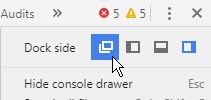
2. Open F12 Dev tools Inspector

Undock this to a separate window

► dig deep into (unpublished) TTN JavaScript code to hook into the (parent window) TTN Console here

►►This Dev Tools Inspector window IS a Browser application, so easier is to:

3. (on the 2. Inspector) Open ANOTHER Inspector window with: Ctrl-Shft-I or J

You now have 3 Windows open: TTN Console ► Inspector ► Inspector ON Inspector

►► This second inspector can now hook into the WebSocket data of its parent (the first inspector)

  • Open the Sources Tab

  • Open the Snippets section

  • Create a New Snippet
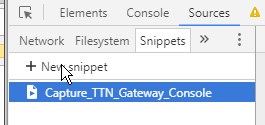
  • With code:

SDK.NetworkDispatcher.prototype.webSocketFrameReceived = function (id, time, response) {
    if (response.payloadData != 'h') {// not heartbeat
        var gwResponse = (JSON.parse(response.payloadData.substr(1)))[0];
        var gwType = gwResponse.split`:`[0];
        var gwJSON = JSON.parse(gwResponse.replace(gwType + ':', ''));
        console.log('%c'+gwType,'background:yellow','\n',gwJSON);
        fetch('https://rbaskets.in/ulkkdbc', {  // your own HTTP endpoint
            method: 'POST',
            body: JSON.stringify({[gwType]:gwJSON})
        })
    }
    if (this._inflightRequestsById[id]){
        request.addFrame(response, time, false);
        request.responseReceivedTime = time;
        this._updateNetworkRequest(request);
    }
}
  • Change the Fetch API call to point to your own endpoint

  • Run this code with Ctrl-Enter

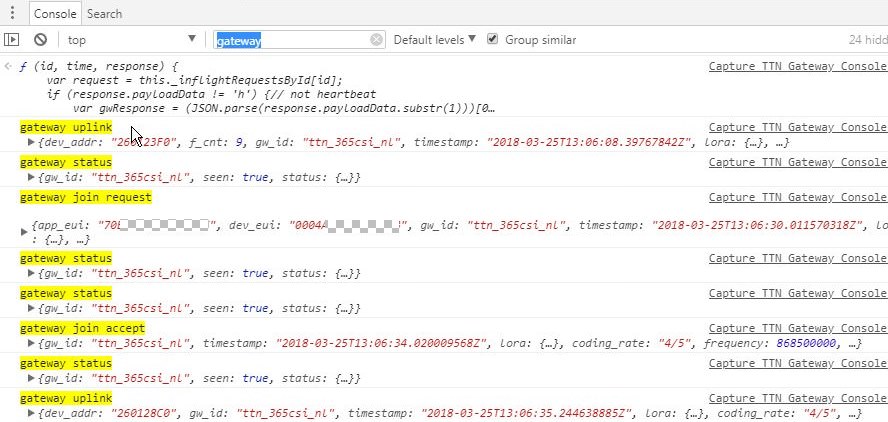
Data is now traced to the Console (in the second Inspector):

Type ‘gateway’ in the filter to filter on gateway messages only:

Disclaimer

  • This breaks the moment TTN changes anything in their data format

  • You need to keep all 3 Browser windows open

1 Like

hi DannyE,
This looks fine! Can you give me the full code…? I want to get the gateway messages alone!

Thanks in advance

The above code is all the code

1 Like