According the the Packet broker here are the top busy gateways in the world.
The No1 goes to a gateway with 16213 uplinks per hour, it is located in Hawaii.
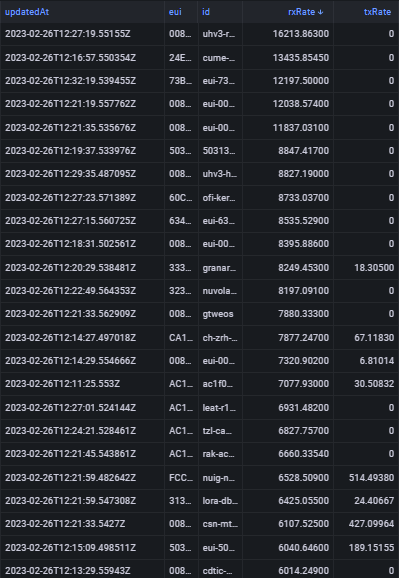
There are 24 with more than 6000 uplinks per hour.
According the the Packet broker here are the top busy gateways in the world.
The No1 goes to a gateway with 16213 uplinks per hour, it is located in Hawaii.
There are 24 with more than 6000 uplinks per hour.
Curious to know how the “Aloha-protocol” holds there. What is the congestion of packet-successrate of this gateway?
In terms of height, altitude etc, is it known which is actually the ‘Top’ Gateway ?
Johan doesn’t show full name but suspect this is uhv3-roundtop-tower GW in the back hills overlooking Honolulu, probably around 350-400m up. (University of Honalulu/Hawaii, V3 deployment?) Would have great views from east of Kahala through to west of Pearl City and beyond I guess as well as much of the shore front area, the airports and Ewa Beach areas. Many GWs in that general area with lots of overall traffic, plus a shed load of Helium miners deployed in a swathe across the whole Honolulu area so dont know if the traffic count included Helium traffic (nodes + GW’s beaconing?) being passed to the LNS then dropped.
Another uhv3 GW (possibly uhv3-hcc-library? near Iwilei) also sees huge amount of traffic which would fit - sees about half rate but at much lower level covering overlapping areas…
Here are the top in altitude, there are a lot of gateways where this field is not completed, so possibly there could be a higher one.
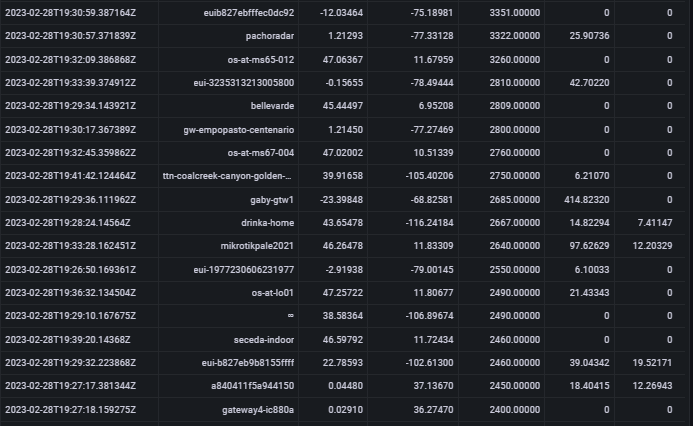
These altitudes are most probably set by the GPS, as cross reference with Google Earth they are passable, the all repot as online to the backend.
It is uhv3-roundtop-tower, see it varies between 12000 → 16000 per hour. I would not say it is the one with the widest populous area it can view. Certainly one area with the most LoRaWAN nodes or chattiest ones or a combination.
Maybe we need to put a tender out for a node to be deployed there, then we can monitor it and see packet success rate.
Perhaps we ask @chriszane for back story - believe connected to some of the uhv deployments ![]()
Chris, care to comment or share some data? What is driving all that traffic? What is local loss rate for close in nodes? Is it possible to get a ‘canary’ node/dashboard shared to wider community?
That does seem like a lot. It’s not us (at least the UH folks who installed the gateways). Not sure what that is, we haven’t been looking at the gateways recently so I’m glad that they are still working.
What sort of data would you folks want to look at?
sorry - this is chris zane. guess I got logged in with the UH network engineering account!
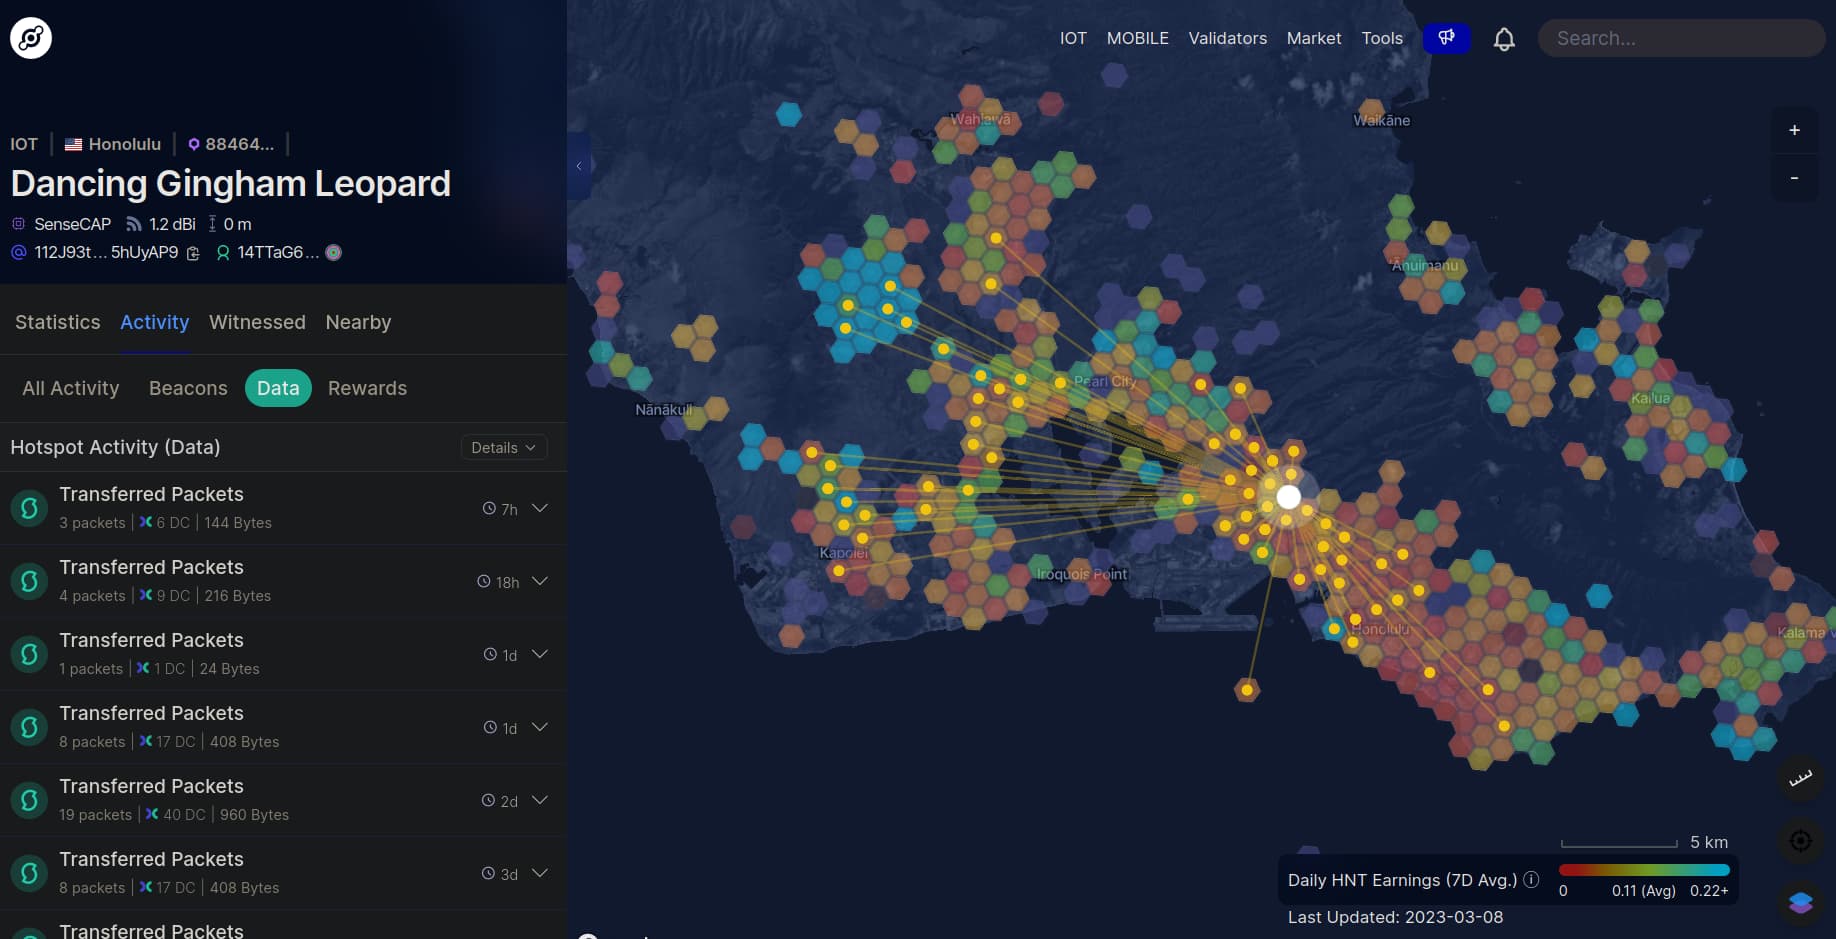
Regarding Helium data traffic, that seems unlikely. While there are indeed hundreds of Helium GWs in the area, it seems they are not much rewarded for data traffic. This is an example of a more-than-average successful GW (in HNT terms), less than 20 packets (uplinks) per day. This GW might of course see a lot more Helium packets, this only shows the ones it is rewarded for. To put things in perspective, those 16k uplinks per hour seen by the TTN GW, if they were Helium traffic (and each packet as small as 24 bytes), would represent 384k Data Credits = USD 3.8 per day to be shared by those 100s of Helium GWs.