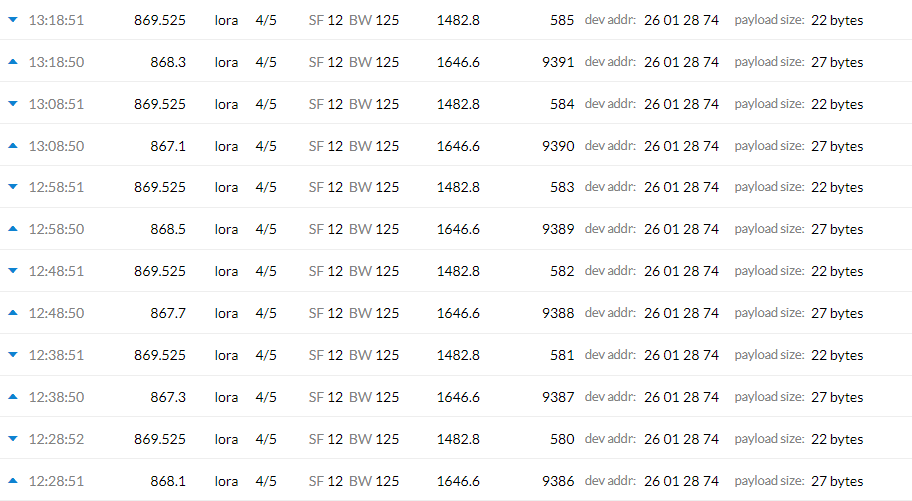
since last Saturday I have an issue with the ADR feature. Before saturday 5:08pm (CEST) the spreadfactor of my testnode was always 7 or 8. Between 5:08pm and 11:00am on Sunday there was no package received at all. Since Sunday my node only sends on SF12 oven though the gateway responds with a downlink that it should be changed.
I created two screenshots. I already restarted the gateway but nothing changed. I didn’t restart the node (and only want to do this, if it is really necessary).
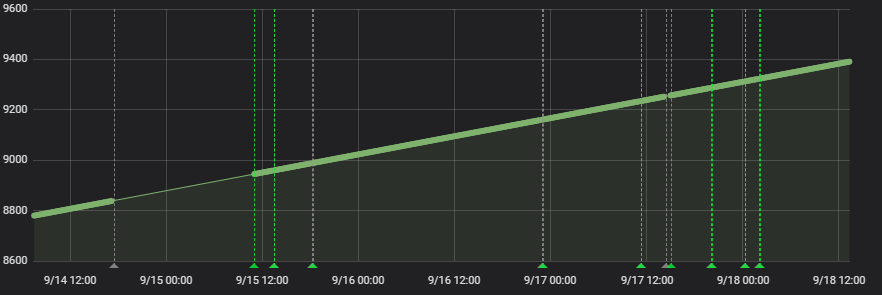
Sorry. The last Screenshot is just the counter value that the node sends. This just shows the outage during the last weekend (and I’m not sure why that happened, I think there were bigger problems at TTN!?).
You seem to have something which has changed seemingly without changes on your part, but it’s worth making sure. Also something like a broken antenna could create such a difference.
Do you have any way to know from the node if it actually received any of these downlinks?
What do the downlinks contain? ADR MAC commands? If so, what do they command?
Why are the downlinks even being sent? For uplink confirmation alone, or for some other purpose such as ADR?
They could be if the network is actually responding to a very weak false reception on another channel, caused by having the node too close to the gateway. Ideally software should not get distracted by those, but it’s possible to not get the de-duplicator right in a way that does.
You haven’t actually shown the details of the MAC commands contained in the downlink.
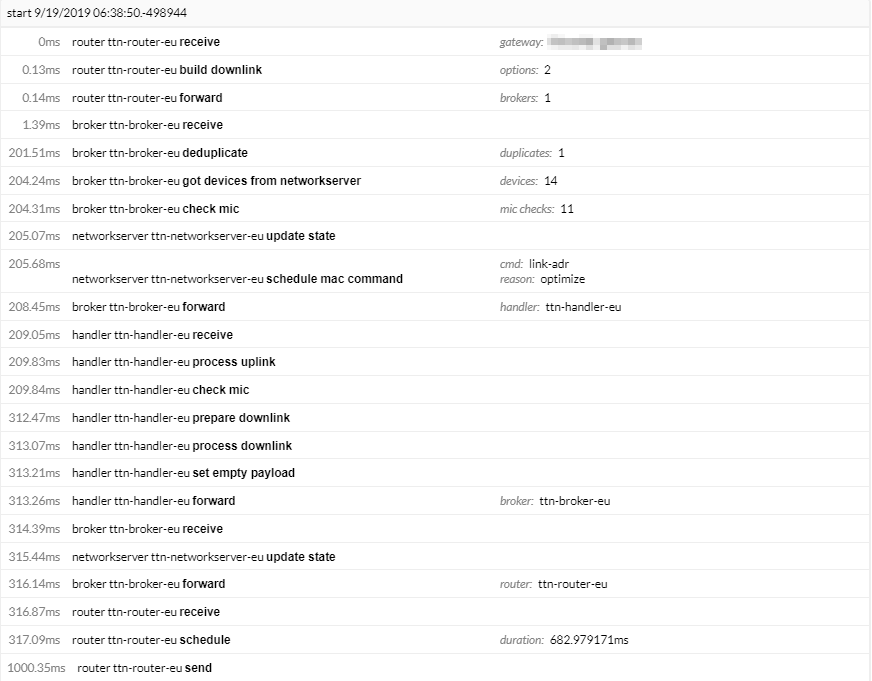
This is the screenshot from the gateway console. I don’t see any reason Why the node shouldn’t receive the downlink.
The downlink not matching the time or frequency on which the node is receiving would be a possibility. No information about what the node is doing has been provided.
But it’s also unclear what the downlink contains, and thus what effect it would have if it were received.
05 03D2AD84 = RXParamSetupReq + 4 bytes of details
03 55 FF00 01 = LinkADRReq with
DataRate_TXPower = 0x55
Which (assuming EU868) looks like it’s commanding SF7 / 125 kHz
So the question seems to be: why is your node not receiving, or not honoring this?
One possibility is that the fixed frequency of 869.525 and SF12 suggest all of these are being sent with RX2 settings, yet the time delay seems to be only one second, which sounds more like RX1. Can you compare the actual gateway timestamps for TX and RX and see if they differ by 1 million uS or 2 million?
I’m not really familiar with the EU868 regional specs but it appears that RX1 should be on the same frequency as the uplink.
Perhaps you can figure out if:
The node does not properly implement RX2
The network is somehow sending mixed up TX requests, ie, RX2 frequency at RX1 timing
Additionally, SF12 is LoRaWAN RX2 settings - TTN EU868 does not use that, but a non-standard SF9.
Note that The Things Network uses the non-standard SF9BW125 data rate for RX2 in Europe.
So if the above replies at SF12BW125 on 869.525 irrespective of uplink frequency are being commanded by a TTN server, to my unfamiliar eye it would seem that server is a bit… confused.
Perhaps someone more familiar with everyday operations in Europe can chime in and offer a better of explanation of what is wrong (or perhaps not actually wrong)
I can record all the transmissions tomorrow with a software defined radio. So I can measure the timing perfectly. Unfortunately I’m not able today.
It’s strange that this happened after the outage on Saturday. But if this is an overall TTN problem others should have this issue too.
Btw: I’m using a Laird Sentrius RG186 Gateway. Updated the firmware two days ago, which didn’t fix it.
I expect you can see the hardware timestamps (ie, the large integers - microseconds, not clock time) if you click into a pair of uplink and downlink packets, and thus not need the SDR.
But anyway, irrespective of relative timing I’d like to hear someone familiar with how things are supposed to work in Europe explain if this fixed SF12BW125 downlink on 869.525 irrespective of uplink frequency is proper… or as improper as it’s looking to my eye.
Really looking for the microsecond counts, not the clock time. The clock time is suggestive, but it’s interesting to note it’s not an integral number of seconds.
I mean something like
uplink 123897654
downlink 124897654
There should be an exact difference of an integral million microseconds, or two, or five…
I guess it’s possible your setup doesn’t expose this though.
…Anyway I think the real answer is going to be someone with region or backend knowledge explaining those very odd invariant SF12BW125 869.525 air settings.
That is RX2 frequency. If SF12 is used in RX2, that means the back-end sent several ADR packets at SF9 and the node did not respond correctly to those. Next the back-end switches to SF12, assuming the nodes RX2 parameters are not correct. The node is probably using SF9 and won’t receive the ADR command.
As far as I know there is no way to recover from this without resetting the node and going through a new OTAA cycle (and I’ve read claims even that didn’t work and the node needed to be deleted and add anew in the console and updated with new keys)
Thanks for the explanation, that makes a lot of sense and seems very likely where the asker’s setup has gotten stuck.
Only thing I’m still wondering about is why the delay seems to be only 1 second, though admittedly that is coming from the clock times and not the uS timestamps.
As far as I know there is no way to recover from this without
Ouch. Personally, I’ve never built a save-the-day compatibility measure and seen it turn out to ruin the day
(contemplates rigging the packet forward to recognize these and put them back on the correct SF)
It would be worth figuring out if your node supports TTN’s RX2 settings.
Can you get any logging out of your node? If so, leaving it running for an extended period of time with something collecting logs and then running searches on them can be a good way to see a variety of behavior (ie, you could look for a log message indicating a packet was received in RX2). I actually have a handful of development test nodes scattered about each being managed by a raspberry pi that collects the logs, and can also flash new firmware into the node (OpenOCD on the pi with its GPIOs connected to STM32 SWD pins). Some are close, some are placed remotely where signal strength is marginal and ADR increases the spreading factor, so I get results from both cases.
Rebooted the node and now it works. I don’t think its crosstalk, because it worked for 3 months and after a reboot it starts working again.
I’m using the example of STM as a base for my node. Maybe I should check if there is an update or any hint why this happened. Thanks to you all for assisting me.