Hi, my TTGO Lora32 node running LMIC with ADR enabled, region AS923, starts at SF7 after joining (only 20m from gateway), but after a few days moves to SF8 for reasons i cannot understand and I’d like some advice on how to troubleshoot this. I have already decreased the ADR margin on the console from 15 to 12 but it still happens.
As far as i understand the ADR doc, there is no reason to decrease the DR when
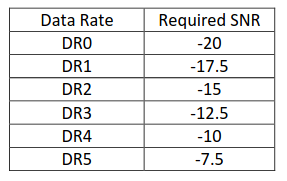
SNRmargin = SNRmax - SNRrequired(DR5/SF7) - ADRmargin = 10 - (-10) - 12 = 8 so Nstep = int(SNRmargin/2.5) = 3
Nstep is obviously > 0 so i don’t understand why ADR wants to decrease the DR.
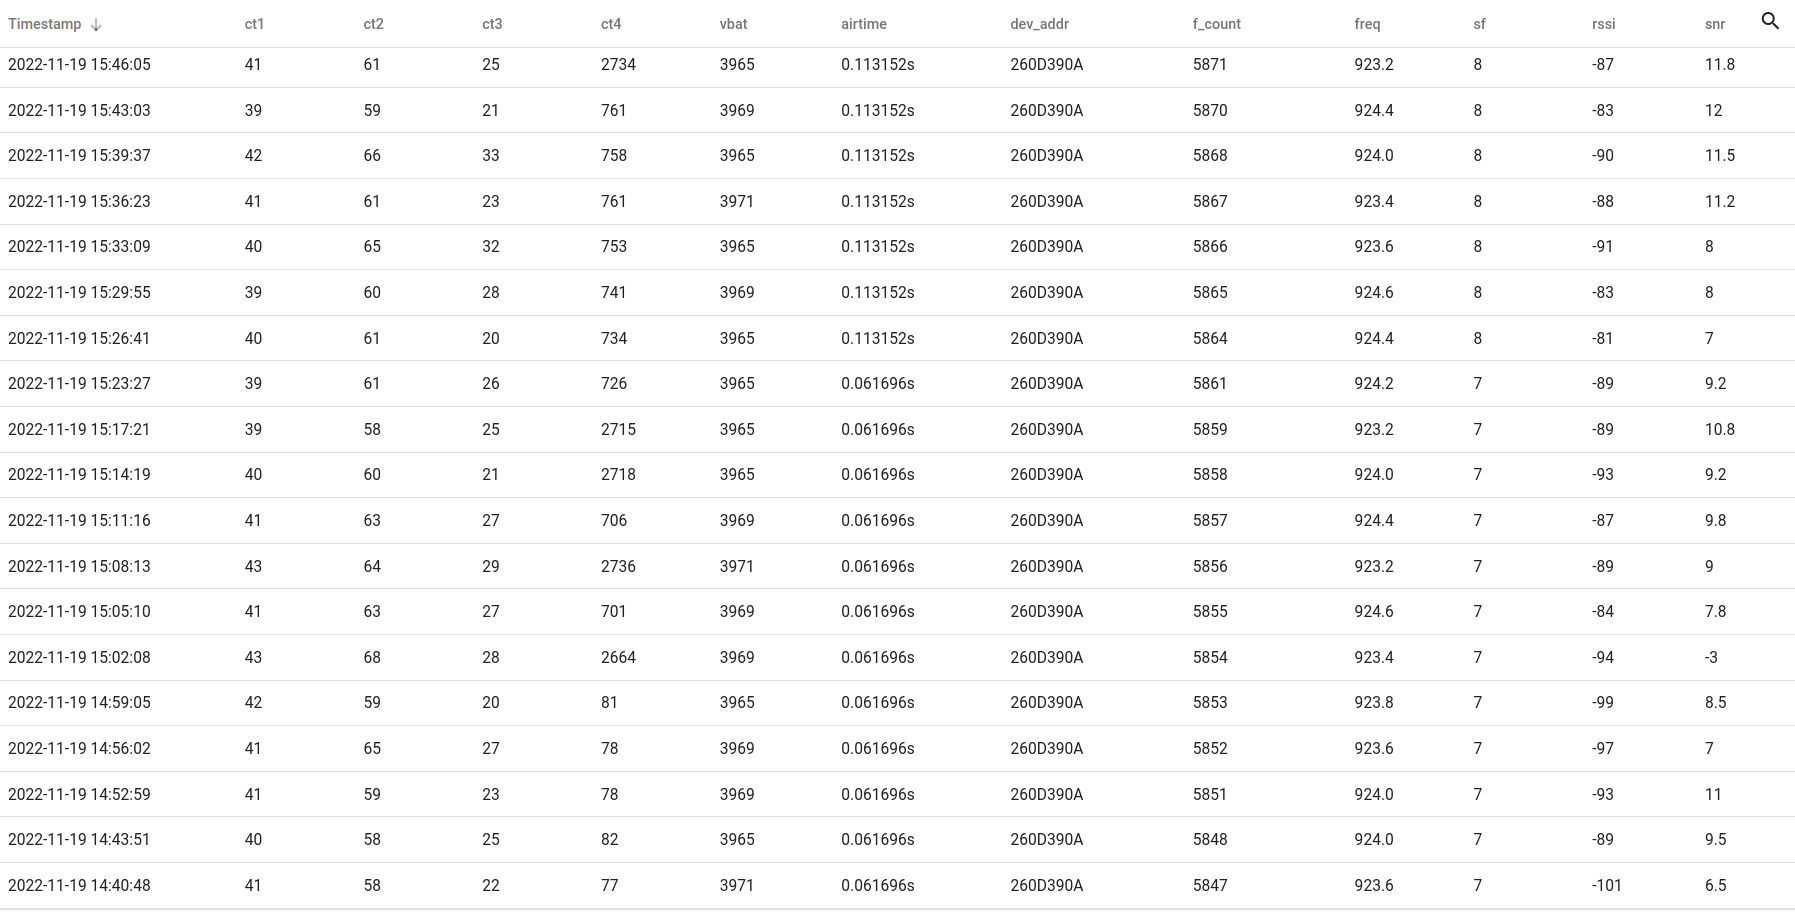
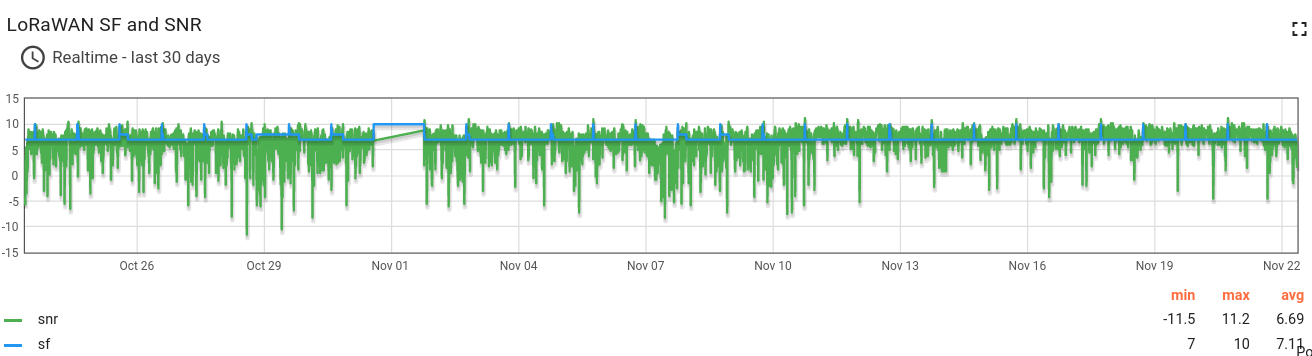
This is a graph of the SNR and SF of the node
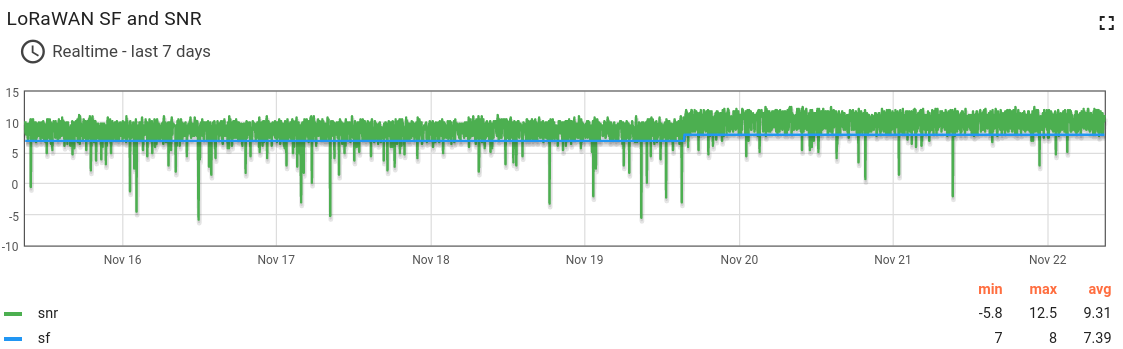
So it is at SF8 now, and i would expect it to move to SF7 because the Nstep is 2.
SNRmargin = SNRmax - SNR(DR4/SF8) - ADRmargin = 11 - (-7.5) - 12 = 6.5 so Nstep = int(SNRmargin/2.5) = 2
Just for reference, I have similar nodes (further away), that stay on SF7, or occasionally move to SF8 but then go back to SF7, as expected.
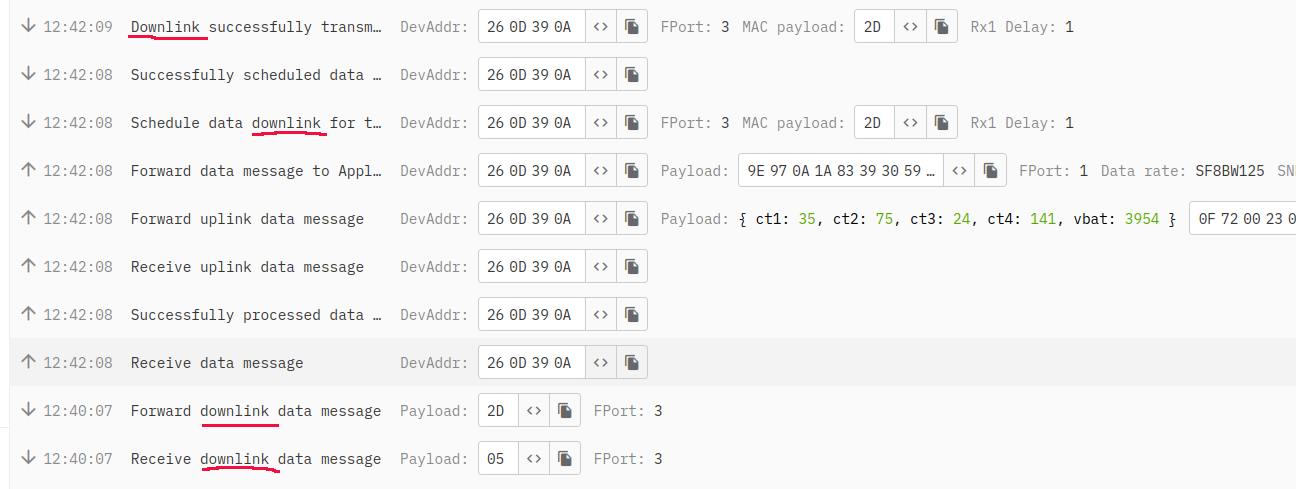
The MAC data on the console (for that first node) show this, does that give any clues?
Thanks for any advice. I could switch ADR off and force SF7, but i’d like to understand what’s going wrong here with ADR.
  "mac_state": {
    "current_parameters": {
      "max_eirp": 16,
      "adr_data_rate_index": 4,
      "adr_tx_power_index": 6,
      "adr_nb_trans": 1,
      "rx1_delay": 1,
      "rx2_data_rate_index": 2,
      "rx2_frequency": "923200000",
      "ping_slot_frequency": "923400000",
...
    "desired_parameters": {
      "max_eirp": 16,
      "adr_data_rate_index": 4,
      "adr_tx_power_index": 6,
      "adr_nb_trans": 1,
      "rx1_delay": 1,
      "rx2_data_rate_index": 2,
...
    "rejected_adr_data_rate_indexes": [
      5
    ],
    "rejected_adr_tx_power_indexes": [
      7
    ],
    "last_downlink_at": "2022-11-22T01:13:13.749282621Z",
    "last_adr_change_f_cnt_up": 6844
  },
  "mac_settings": {
    "rx2_data_rate_index": 2,
    "rx2_frequency": "923200000",
    "supports_32_bit_f_cnt": true,
    "status_time_periodicity": "86400s",
    "status_count_periodicity": 200,
    "desired_rx1_delay": 1,
    "desired_rx1_data_rate_offset": 0,
    "desired_rx2_data_rate_index": 2,
    "desired_rx2_frequency": "923200000",
    "desired_max_duty_cycle": "DUTY_CYCLE_1",
    "adr": {
      "dynamic": {
        "margin": 12
      }
    }
  }
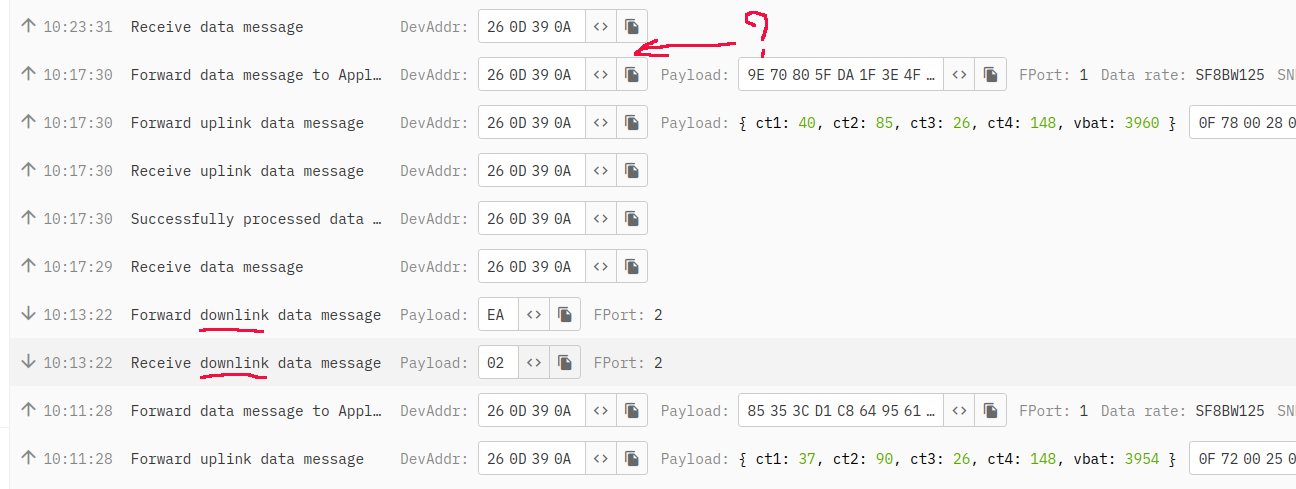
Detailed list of uplinks when the change occurred (3 minute interval is just within FUP on SF7)