I’m in Southern California and am wondering whether any of the gateways in the area see any activity. Is there anywhere I can look at any stats, like number of packets forwarded per day or month?
WHat do you mean by “build it yourself”? Is there an API to get the data?
AFAIK there is no way to view gateway stats from other gateways than your own. TTNMapper is somewhat of an indication (under Advanced Maps you can select a given gateway and date range as well), but that does only show nodes with GNSS, that are actively forwarding to TTNMapper, which is by no means a definitive way of telling activity. There could be thousands of active devices on a gateway that do not show up on the map.
1 Like
If you refer to the extensive documentation their is a section on API.
If you want stats you need to build your own “monitoring”.
Any gateway, mine, yours or theirs.
There is an API you can use to get some information.
An example URL is https://mapper.packetbroker.net/api/v2/gateways/netID=000013,tenantID=ttn,id=g-s3-testgw011a-pi3-831no1-hp10
Replace the string after id= with gateway id which you can find on the TTN map.(https://www.thethingsnetwork.org/map zoom is your friend as multiple gateways in an area might otherwise not show)
3 Likes
Where is the API detailed in the Getting Started section you linked to?
Thanks much! Could not possibly have found this by browsing the docs…
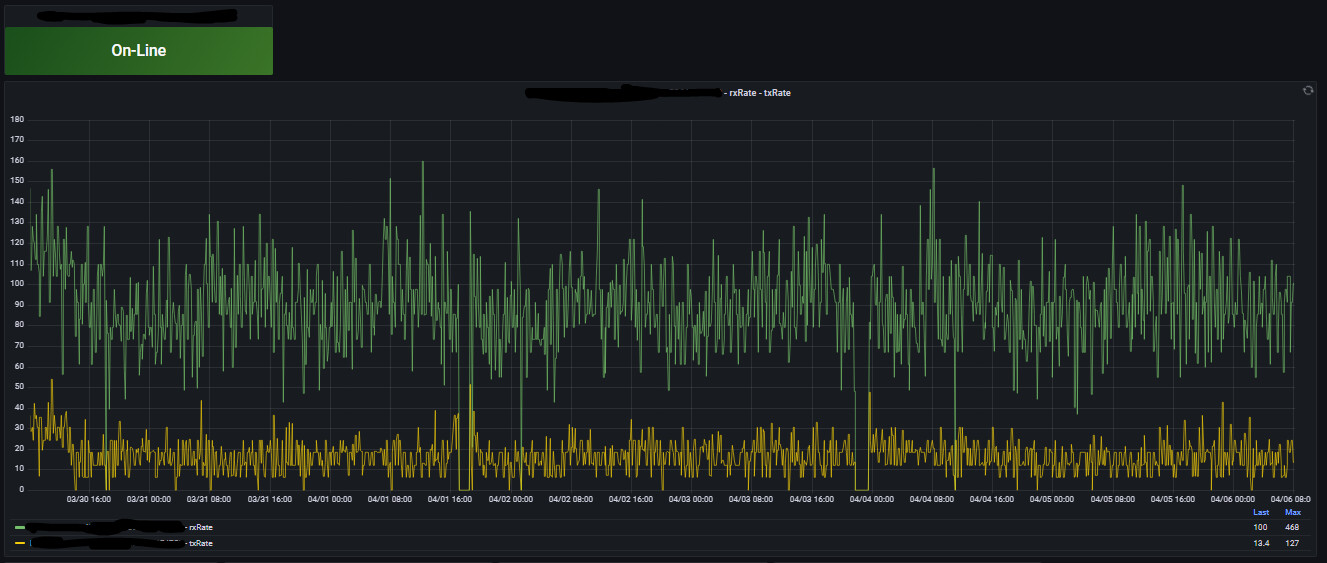
Some indoor gateways show rxRates of 36 to 76 pkts/sec, how is that possible? I mean, do those people have hundreds of devices stashed in their building? It’s also not documented over what period the rates are averaged.
Yeah, just try to find the info about rxRate starting from that page if you don’t already know exactly what you’re looking for!
It is the approximate average rate per hour calculated over an period of 10 min (something to that effect were the explanation of this figure)
Nope, still can’t see it in getting started …
The swagger docs say:
          "rxRate": {
            "type": "number",
            "description": "Received message rate (messages per second)",
            "minimum": 0
          },
          "txRate": {
            "type": "number",
            "description": "Transmitted message rate (messages per second)",
            "minimum": 0
          }
So you’re saying the docs (https://mapper.packetbroker.net/api/v2/openapi.json) are wrong and it’s a per-hour rate (which is a lot more believable).
1 Like
Physics, mostly electromagnetic radiation.
Sure, why not. And/or maybe not all their devices but also the buildings next door that are in range.
Sorry it is average over a 6 min period.
Please ask the boss his explanation.
1 Like
Indeed the packet rates are per hour, not per second, the OpenAPI documentation is wrong. We’ll fix that.
They’re observed over a random interval between 8 and 12 minutes, so roughly 6 data points per hour. We don’t show history.
Advanced gateway activity stats (uplink/downlink traffic over time, channel utilization, RSSI per channel, packets per data rate, round-trip times) are available in the NOC, part of The Things Stack Cloud and Enterprise.
1 Like