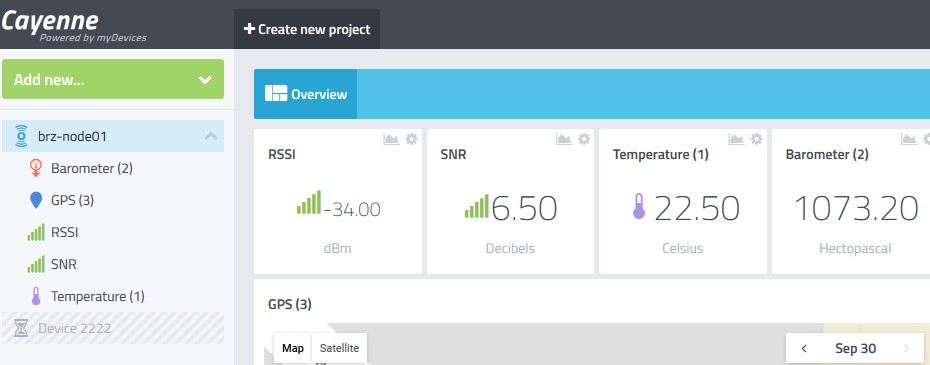
if the TTN side is done… now create an Cayenne project (choose LoRa as device) and add widgets corresponding to your data, that data must be formatted in LPP format (which is easy) so that Cayenne knows what widget to update in the dashboard.
THANK YOU VERY MUCH!
Now I have found the device UNO in the LoRa list. It is working with the UNO .
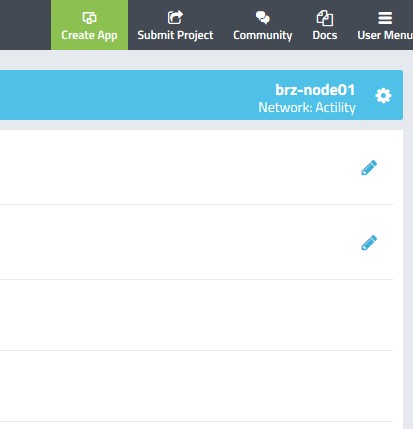
However when I select the Node device, it does not show the device paraTHE THINGS UNO CAYENNE INSTALL.pdf (214.5 KB)
meter box. Very strange!
restarted a few times without success.
I did check the Lab procedure and reinstalled the Node.
As you see in annex the UNO is working, however the Cayenne Node dashboard is still not receiving data.
The Things console is properly logging data from both devices UNO & NODE.
What installation errors I have done?
looking forward again for the GOLDEN tip.
Finaly it work
Cayenne menus are slow :
Select first LoRa then device in list at the very bottom: wait a bit and move back to the top of the screen, in order to fill in the device ID. ThenThe Things Node OK.pdf (171.3 KB)
BLACK MAGIC
You certainly got a sherlock holmes Loop
Many Thanks again
Now I can concentrate on the real stuff: select the air pollution sensors and the calibration method
For the last couple of weeks have been seeing a weird problem with one of 3 identical sensors at different locations in UK and wondering if others have seen anything similar before/have a solution.
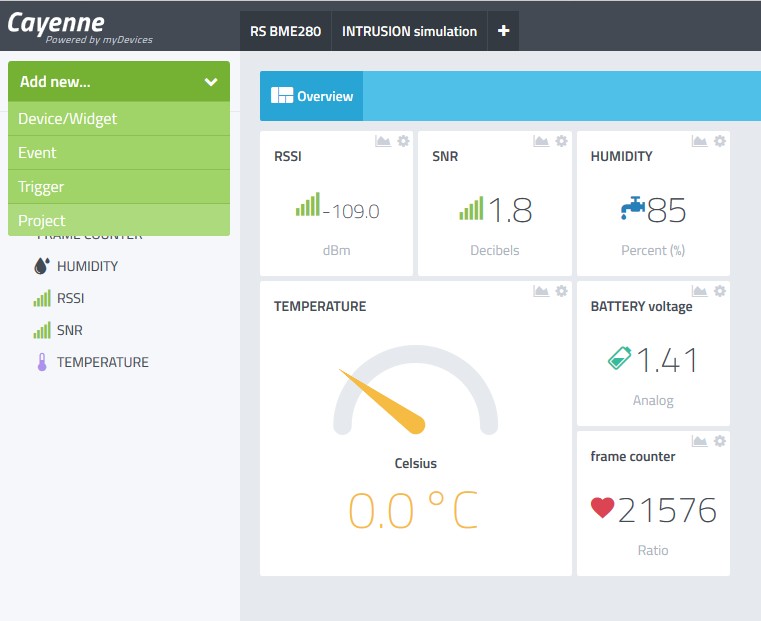
All three nodes (Laird RS186T&H) have worked fine for many months. They show up on Cayenne dashboard and links shared with clients so they can view/monitor no problem. About 2 weeks ago one node lost its historic Temp data (last hr, last day etc.) an hasn’t recovered. It is showing 'live data fine so clearly updating fine, passing data to TTN GW and back-end fine etc. The other two continue to work as expected. When I drilled in I could see that both live data and historic data is retained and displayed fine for other parameters e.g Humidity, RSSI (typically -38 to -45dm), SNR etc. so doesn’t appear to be a node or GW problem and as it shows live Temp I assume not a TTN back end or TTN/Cayenne integration problem…
Anyone see similar? Solution? They are running on same TTN App and in same Cayenne account/dashboard…
When I look at other parameters I see appropriate timescales on X-Axis of any historic graph, the temp chart is stuck showing Jan 01 12AM to Jan 01 12AM…
Update Just found time to dig into the Cayenne ‘Data’ tab vs Overview on the dashboard and I can see full set of data for all sensor data/metadata - including the historic Temp data by minutes, Hours, day, etc… Looks to be a display/presentation issue - any ideas how to force reset/correct display of data in the graphs as options on dashboard look very limited.
Solved: Resetting the dashboard for the device then re-configuring all related widgets seems to have solved with historic data - inc from before the fix - now available again with correct chart timescales etc.