Hello,
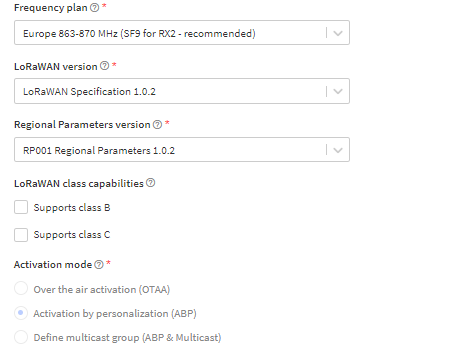
Firstly I got my own gateways and the end device are working on (ABP).
The device is supposed to transmit every 15 min and it does.
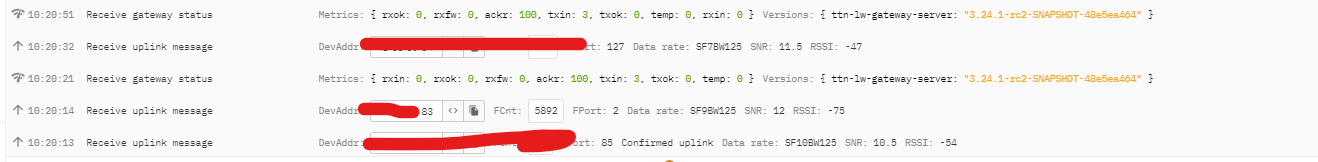
I can see the traffic in the gateway live data, but some times the data does not show on the application live data and it does not get send to the integration. As you can see from the images below there is missing a data. Some times this gap larger
Radio link not OK, however in your case the RSSI and SNR seem fine
The FCNT has to increase for a packet to be accepted. If your device ever sent a packet with FCNT=20 (for example), any packets with a lower FCNT are ignored. If your device restarts the FCNT (eg. restart from 0 when it is reset / battery replaced), the first 20 or so packets will be ignored, and the first packet that can make it through will be the one with FCNT=21. If you use OTAA, you generally don’t have to worry about the FCNT (a join resets the session, setting the FCNT that the lorawan server expects back to 0). My advice would be to use OTAA and restrict new joins to the minimum.
Errors in your integration, like forgetting to resubscribe after a reconnect when using MQTT (this was my problem at one point)
I would not consider the application data live view to be a reliable indicator of whether the data stream is missing data.
Hello,
The devices that I am using are factory made to use ABP and cannot be changed.
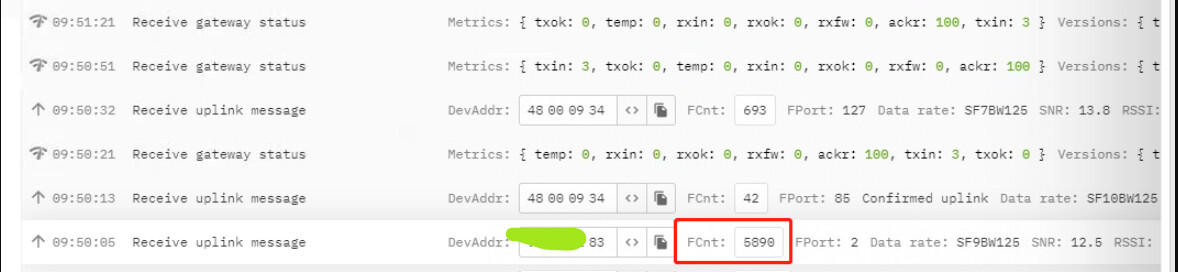
I can see (Gateways Live data) that it is sending data every 15 min and the FCNT is going up.
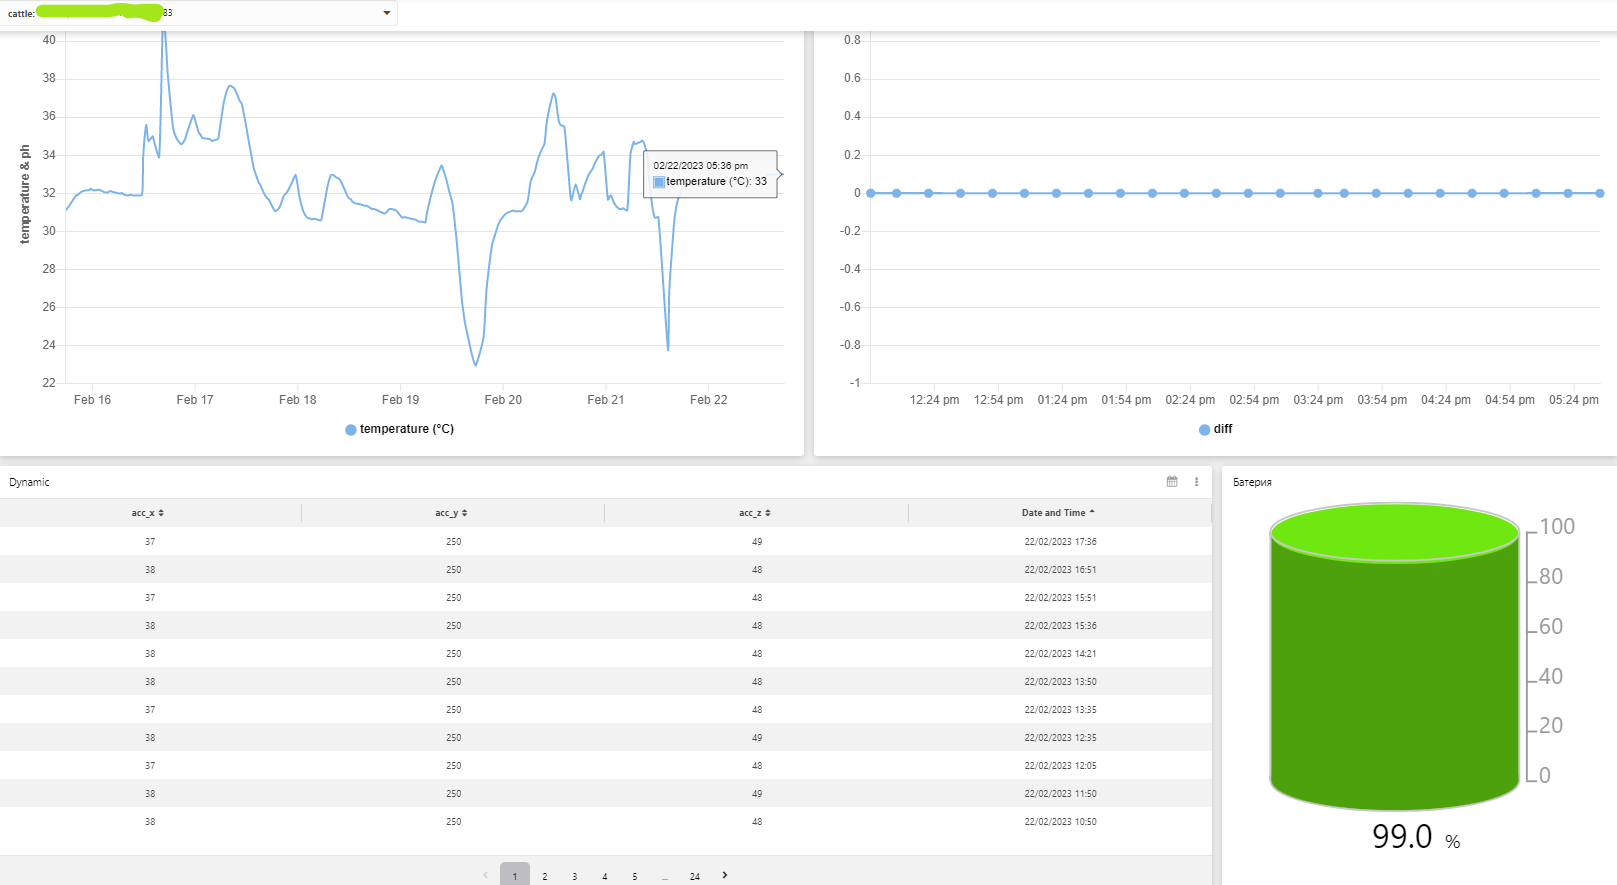
The devices have an operation temperature of 23 to 45 Degree Celsius. When it manages to transmit the data success, I can see that the temperature is well above the minimum.
So to be clear of what is happening/observed and is concerning you…
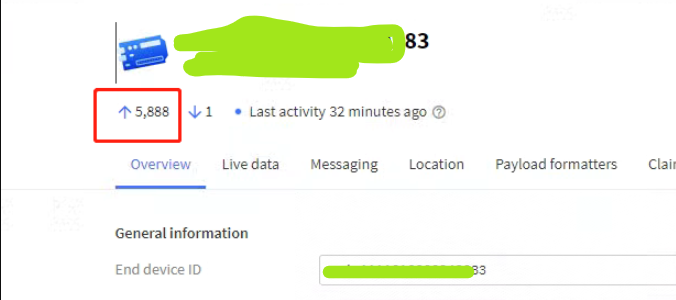
You have sent nearly 6k messages, that have successfully been seen in the TTN console (at the GW level) but not seen on TTN Application/Console view…and 2 are missing from your end application? ~99.97% success?
Do you have data storage integration enabled? Are you able to see the missing data/fcount there when you get a miss? What is your end application, what integration used, how communicated from TTN to your server/application, have you been able to test where the loss occurs (dropped between LNS and TTN integration output, or after integration to your own systems?) Note there is no SLA for TTN, and even full instances for TTI dont have SLA on the integrations/onward messaging IIRC (I may be wrong there!)
BTW lots of masking of info on you posts - much of what you are masking is sent ‘in the clear’ and is public domain so not worth the effort, and the ‘as received’ payloads are encrypted until you decode them so meaningless to the rest of us. Also grab a string/series of messages and server responses/gateway records rather than single items, and then please post using the formatting tool as formatted text rather than grahics where you can </> what do you see in any of the missing vs correctly handled messages metadata/JSON files. If your decoder handling correctly? (on TTN Device/Application Console or at your own end application server)
Also please try to grab at a consistent time line - across all consoles as showing info singley from different timeframes doesnt really help see what is happening…remember with console views data is only valid when live and open vs later opening a view, as effectively once its gone its gone…
The integration I am using is Tago.io
The device is ’ Cattle Bolus Tracking Device’ from [Hunan Hkt Technology Co., Ltd.]
The decoder decode/bc-100.js at main · HKT-SmartHard/decode · GitHub
I have slightly modify the code, to work in the integration side. I am using the TTN simply to transfer the data. Got 3 more devices that have the same problem
@alexmutafov, before a whole pile of volunteers try to figure out “stuff”, can you confirm that the issue you are trying to resolve is 2 missing uplinks out of 5,890?
Indeed, as I asked above, and that not just a loss from TTN GW Console view to TTN Application/Integration but also back out on 'tnet and ingress into 3rd party servers and then into 3rd party application/database/presentation, so not yet sure if a TTN ‘problem’ or downstream The fact there are more devices having same issue and
Makes me suspicious of system problem in decoder or elsewhere given lack of cries for #MeToo wrt lost message from other users.
@alexmutafov do you run the decoder on TTN servers or just in your application server or both? Note TTN servers for payload decoding are a ‘nice to have’ and not production ready (remember no SLA!) as dependent of other users loads and risk of timeouts etc.
The decoder is ran in the integration.
I believe that the problem is here, because even if I don’t have an integration connected, there is still dropped data on the application level
There is not just 2 dropped.
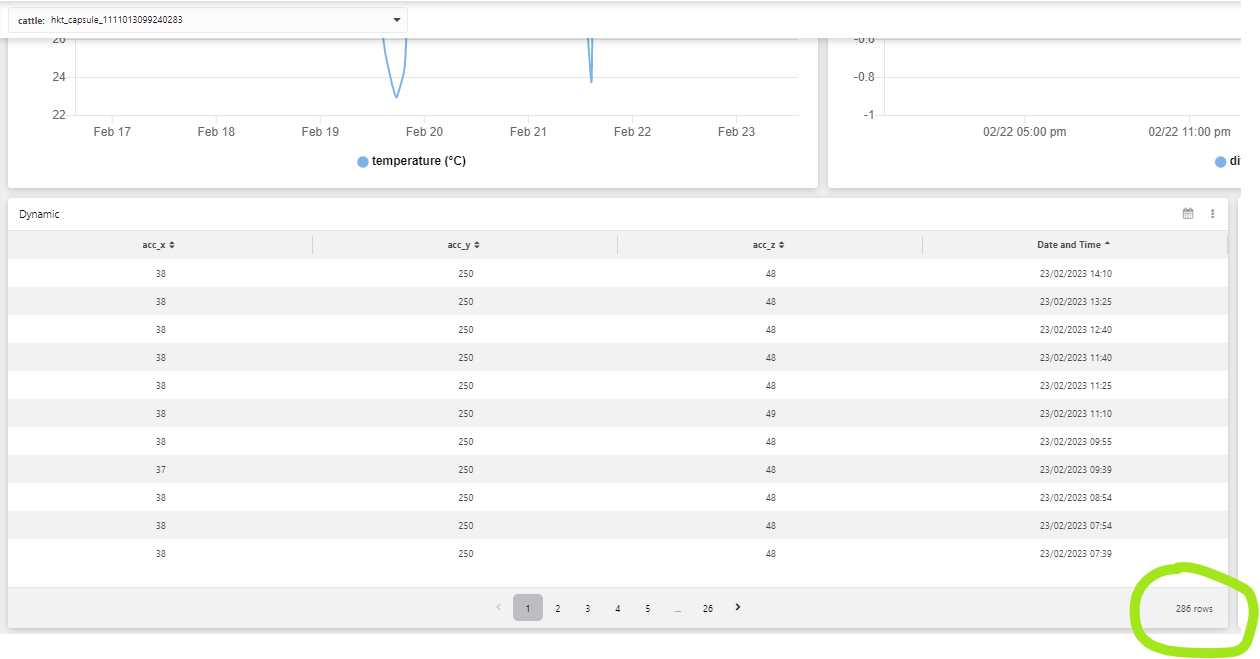
If you have checked the two JSON files you will see that there is a constant stream of data in the gateway (every ~15 min), and drops every now and then in the application, but when the application receives a data it updates the new FCNT. As if it has received the the previous ones
For example if the application has received 50 packages and it drops the next 5 and then receives a packet.
It will update the packet count to 56
Yes that’s normal - the FCount should steadily increment and is used as a security check, if the count was suddenly say 52 and last was 56 system would reject as a replay attack! The count is sent by the node not determined by the LNS or Application server…your Application/database may append its own count but that does not change fundamental LoRaWAN behaviour!
And were these seen in TTN console before loss or does that reflect the total signal chain from node (initiating the count as above!), through RF link, through GW to LNS to App Server, To Webhook, to IP connection, to 3rd Party server etc… as Nick says no clarification or detail means no ability to assist and further discussion likely moot!
As this currently appears to be isolated to your setup as there are no reported issues with packet loss on the network and you’ve linked to a decoder for a device that is called “bc-100 Bio-capsule” and one of the decoder fields is for Gastric_momentum, I’m thinking that just maybe the radio waves are having issues penetrating the large mass of water that surrounds the device.
In theory we’d pick up such details from Cattle Bolus Tracking Device but volunteers tend to speed read posts trying to pick out the over arching topic before getting invested in the detail.
So, once more, can you be far more expansive with what you are doing. Links to the exact make & model of gateway, and more importantly, the device, particularly its antenna & power information.
Plus anything else that may be going on - like next door to a CT Scanner or MRI.
Or the cows are lying down, which I know they do, because I’ve lived in the country - which would make reception of a signal rather challenging.
TBH, getting as many uplinks as you do from a device in a huge bag of water & methane that’s low on the ground is a win. As it was only today that I noticed that I lose uplinks from a weather station outside the office when a staff member uses a particular workbench …
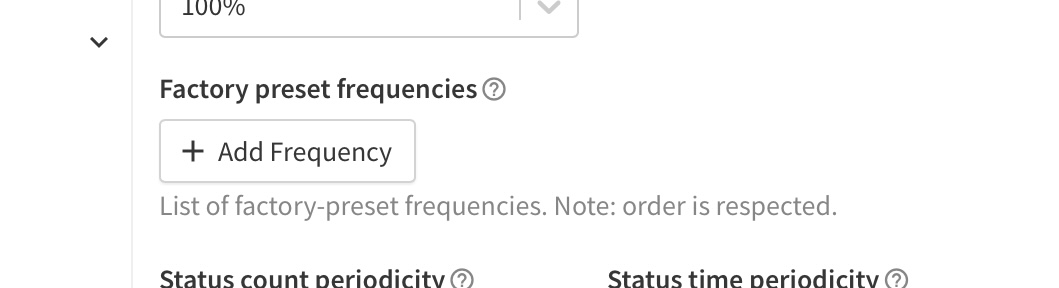
Did you add the additional frequencies used by the ABP device to TTN? By default only transmissions on the default frequencies (868.1, 868.3 and 868.5 MHz) will be forwarded to your application. Only if you add the additional frequencies in the “network layer” “advanced mac settings” “factory preset frequencies” for each device the uplinks on those frequencies will reach your application.