For the future you really want to capture the spreading factor of the uplinks, and also the gateway identities. Also try to keep timestamps in some useful form, scientific notation is hiding changes representative of the seconds/minutes/hours between packets.
And your data series does not span from normal operation on port 2 to the abnormal situation of the join attempts starting on port 0 - its in a data set showing the transition where you would really learn things - time gaps, if all nodes did it at the exact same time or at different times such that there were normal messages on port 2 from some for a brief time even after others started with joins on port 0, etc. If you’re simply not capturing joins but only application messages, you’ll want to include those in the future, too.
What appears to be RSSI in your table (though mislabeled) has extremely high values all the way up to -40 which suggests you have at least one gateway extremely close to the node. There are actually some known issues with things that close sometimes causing confusion.
Additionally if you have a very close gateway, then ADR should ramp the nodes to a very low transmit power level and a very fast spreading factor. If that gateway then stops for some reason, you may have a data outage until the ramp back to settings which reach additional more distant gateway(s). If that process doesn’t work right, it could cause the nodes to give up entirely and try to re-join.
To help debug that, you will also want to start retaining at least the fopts field of the uplink - if you start seeing the ADRACKReq bit a lot, the node is getting desperate to hear anything back to know that there’s still a live network out there. Ideally you’d also have the transmit records from at least the nearby gateway that is presumably yours.
The one thing your data does seem to rule out is a frame count overflow…
Here is a follow up on the story:
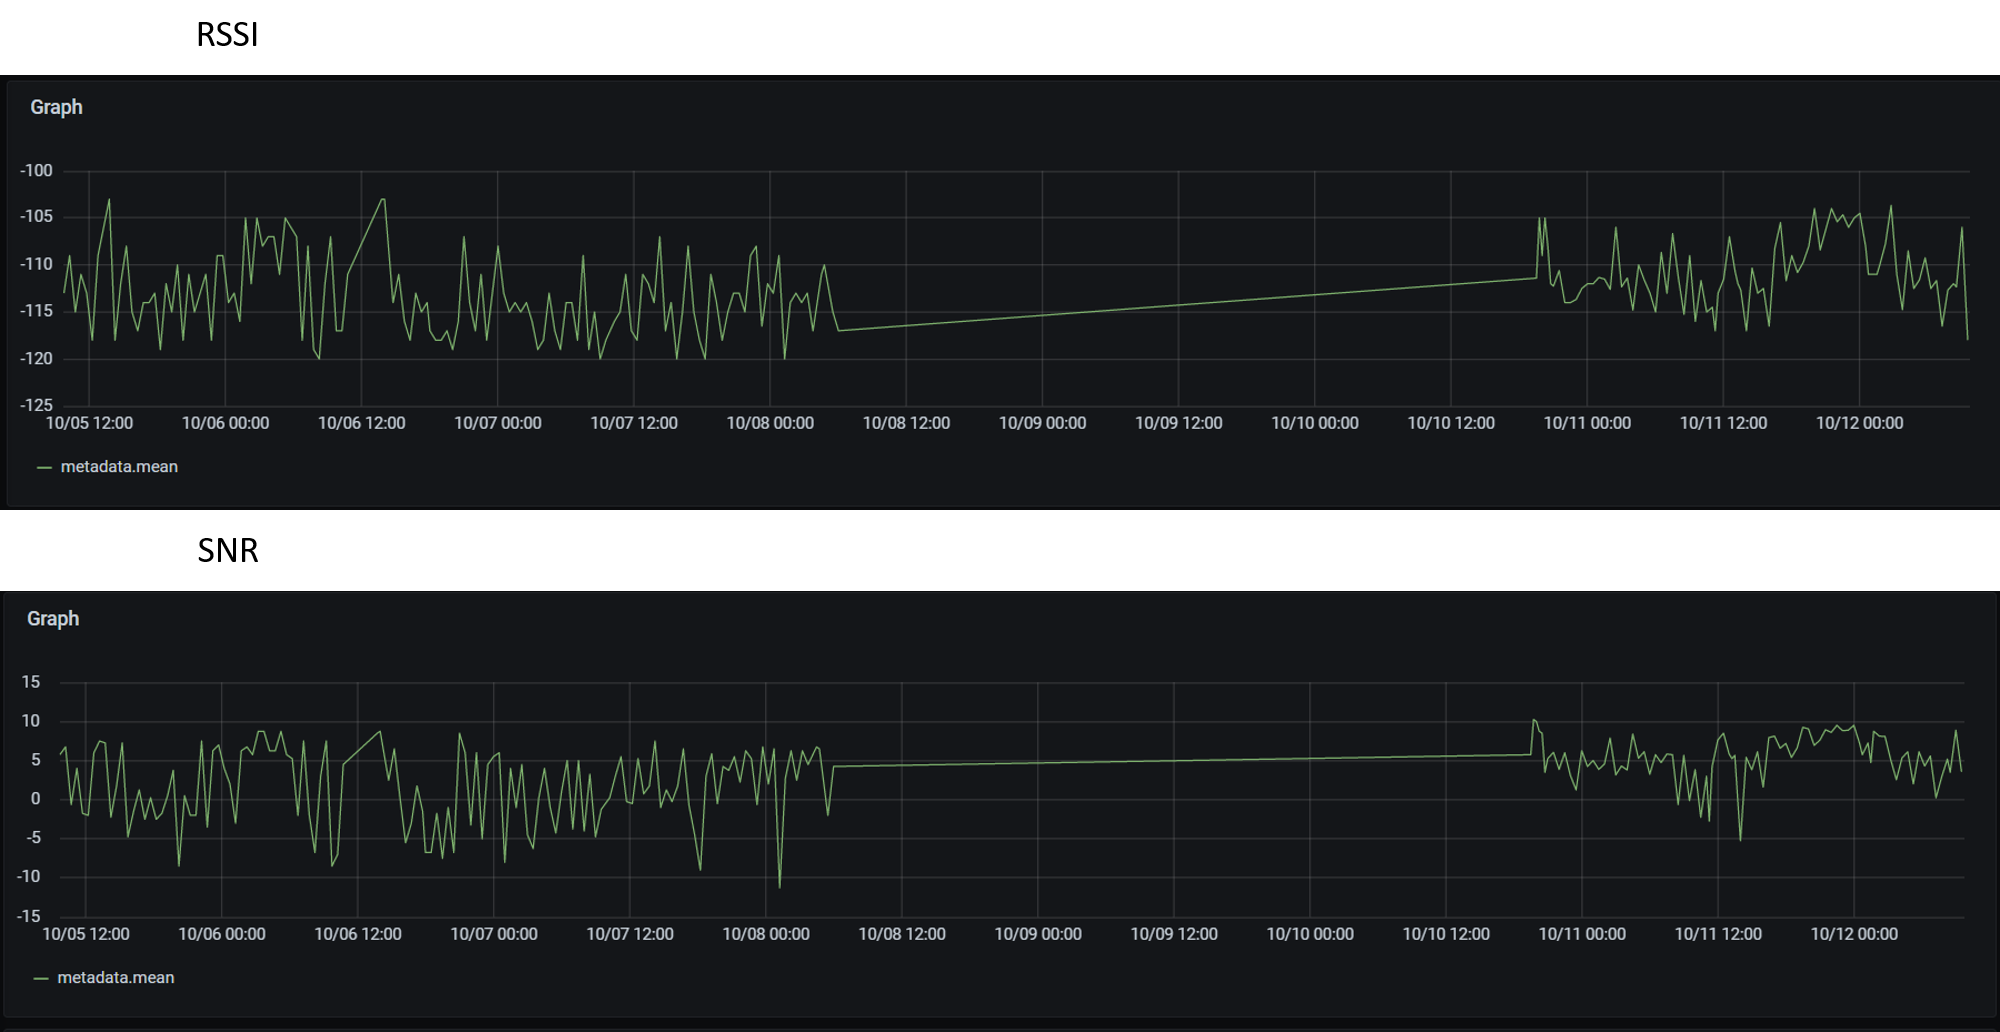
The Gateway antenna is placed at 7 meters roof, and there ar trees btwn. antenna and 2 sensors placed 400 meters away inside a concrete bulding and spread outbehind another concrete building.
Sensors are 2 meters above ground.
the radio strenght are fine and low noise for all four, pic are enlosed.
All 4 died same time, AND ALL 4 RETURNED at the exactly same time.
And between October 8th 6:30 AM and October 11th they were sending OTAA Join Requests, which TTN accepted but still somehow were repeated over and over again?
(Also, just to be sure: I assume they’re not doing an OTAA Join Request for every uplink, even when all is fine? That’s not how OTAA should be used, and in that case, you’d be seeing rejected duplicates for Join Request DevNonces, I assume, which would also not make TTN show the Activation in its Data pages.)
Hi Arjan, i thing you are hitting the point, as far as i can see the devices keep sending join requests in the period. They should not do a request but once. You are probably right that TTN reject the duplicates in order to avoid DevNonces and if the devices keep sending JointRequests they will be banned in a period. I will se if i can change the settings.
Hi @Cfosvang, I have seen similar behaviour. The following was my situation:
COTS devices that routinely send unconfirmed uplinks and periodically (once per 24hrs in my case) send confirmed uplinks. If uplink is not confirmed then device enters an OTAA join process.
Gateway RX continues normally and forwards the device uplinks to the core.
Gateway TX has silently failed and downlinks are not TX’d to devices.
Devices are stuck in OTAA join loop.
In my situation power-cycling the gateway fixed the situation.
Hey everyone, I have a similar problem. I’ve changed my protocol from ABP to OTAA and now I can only see activation messages on the data page. There is no payload provided where I need to see some ascii characters. It only shows me device eui, app eui, device id and dev addr. No payload. Also counter and port seems empty. What couldthe problem be? I am still using the version 2. I would be glad if you help.