Today at 6:30 cet some of my devices 4 pcs, stopped sending payload.
There is no port and no count on datalog.
Are there any problems on the platform to your knowledge?
Things are working fine for me (EU868 with the MQTT Data API). Also, nothing specific on the usual channels from The Things Network Status Page [HowTo].
What’s that “datalog”? Where are you seeing the incomplete uplinks? What are you seeing exactly? Can you confirm that the devices are actually sending? (Of course, seeing 4 of them fail simultaneously would be rare.) What interfaces (MQTT, some integration, …?) are you using? Which region? Do you have access to a gateway and if yes: what’s its Traffic page in TTN Console showing? Any screenshots of the application’s Data page?
All 4 devices is located in the same application and they all stopped sending payload simultanesly.
Other applications (and devices) works fine.
what shows up is:
time
DevID
App addr.
AppEUI
No counter, no port and no Payload.
Datalog = data in application on the console
Do they show an orange thunderbolt icon? Then those are OTAA Activations (hover your mouse over the icon to see that), which would indicate that all 4 devices have somehow reset. But that’s just a wild guess; a screenshot will really help.
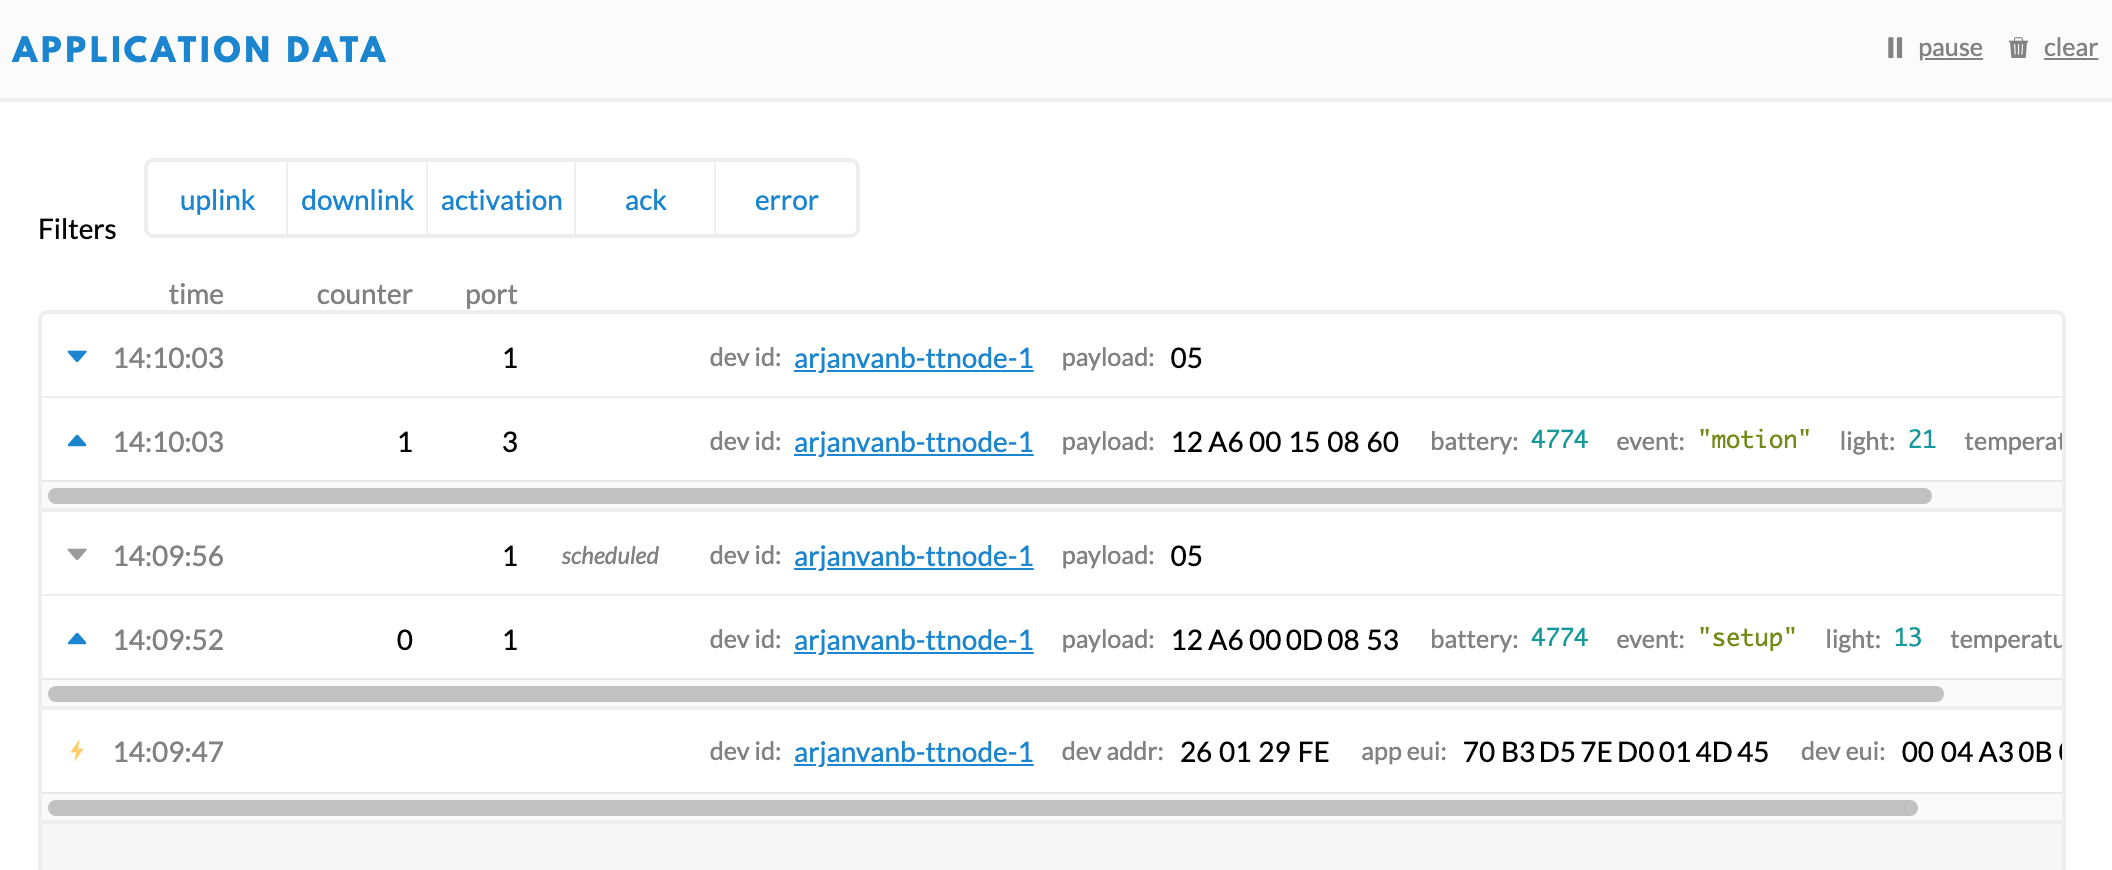
it shows the orange Thunderbol, enclosed screenshot.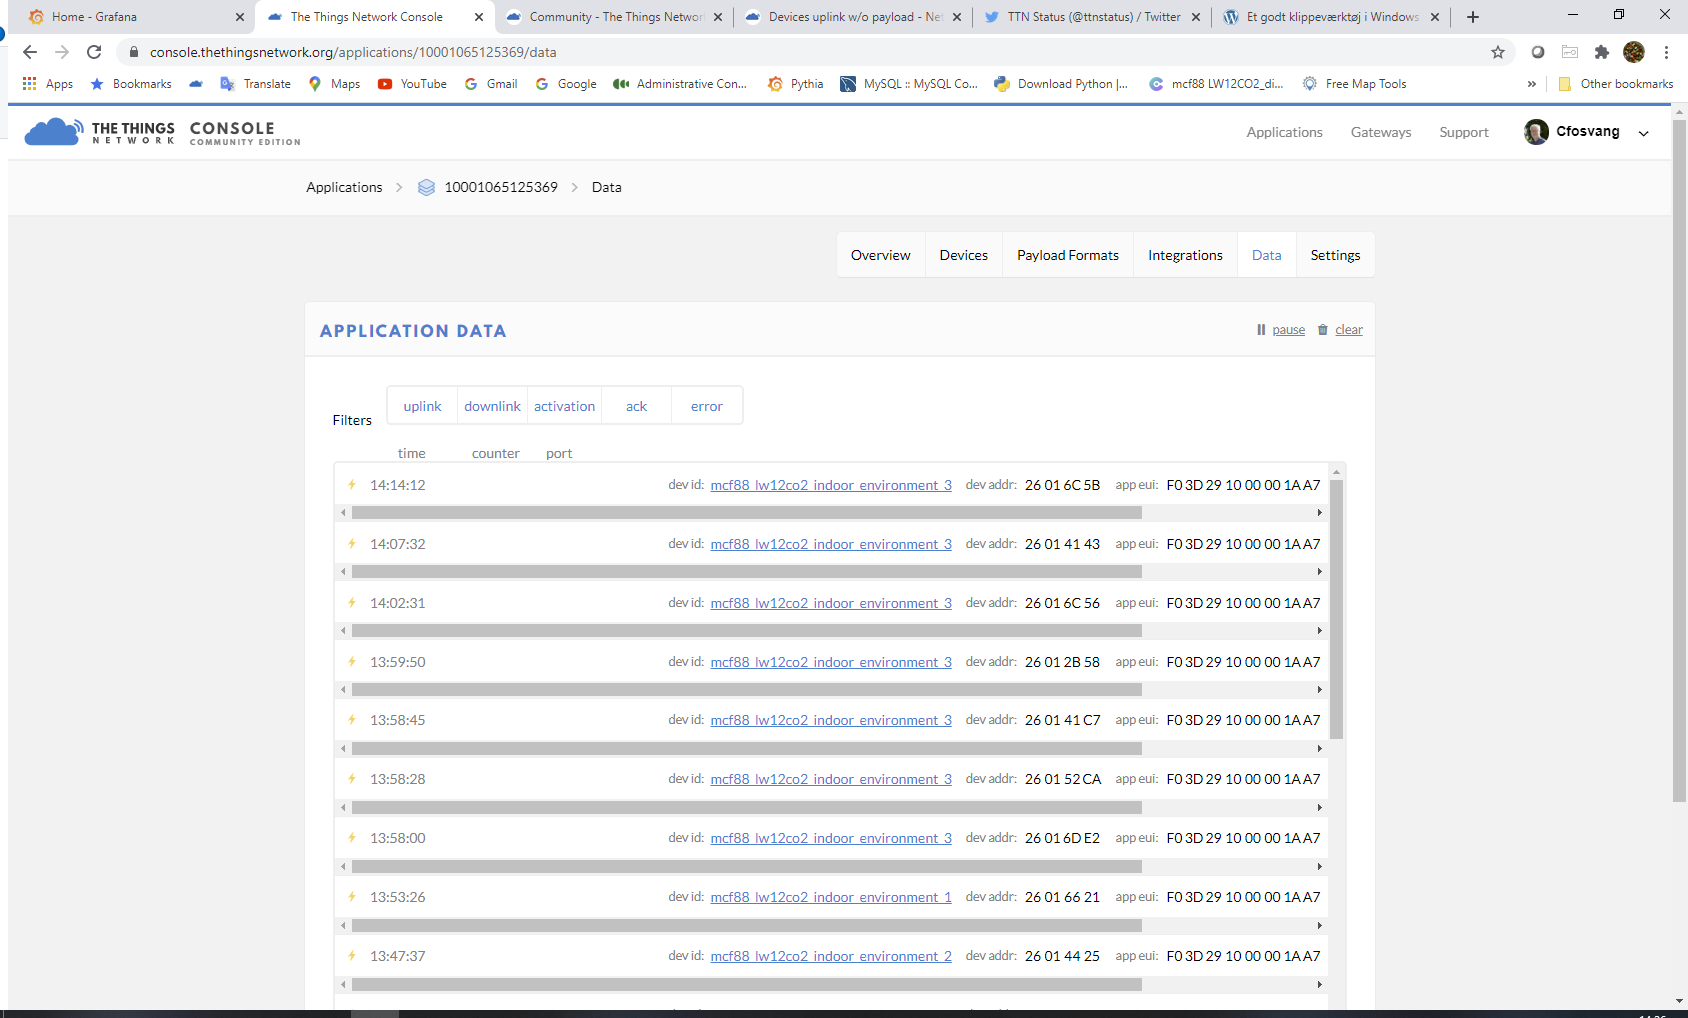
So, the devices are trying to re-join. TTN has accepted those joins, and will have commanded (one of) the gateway(s) that received the Join Request, to send the Join Accept. Apparently the devices are not receiving that, or for some other reason keep sending Join Requests. (Or do they? I only see device 3 repeating the Join Request in the screenshot.)
That’s all we can tell.
There could be many reasons why 4 devices decide to re-join at about the same time (did it really start at 6:30 for all 4?), but without any background information all are wild guesses. Like maybe they exceeded the maximum uplink counter (how many messages did they sent, and are they using 16 bits or 32 bits counters, were they installed at the same time?), maybe they lost power at the same time (how are they powered?), maybe they are running into the very same bug (what devices are those, how long have the devices been operational, what LoRaWAN stack are they using?), maybe all were not getting ADR responses and decided to reboot (are they using ADR, can you see any history as for SF of the uplinks?), maybe …, maybe …, maybe …
You’ll need to figure out what changed and compare to your other devices; all things look fine as far as TTN is concerned.
Indeed; even if there were a temporary outage at TTN (of which no evidence has been presented), the decision by devices to re-join would be a decision made by those devices, days or at least hours later.
Hopefully you are archiving and retaining your data outside of TTN, including LoRaWAN metadata. Look back at the history of the last week - what were the frame counts? Did the spreading factor start to climb indicating ADR was responding to apparent failure of the downlink path? Did a new gateway suddenly start appearing in the uplink reports?
If you are not retaining that information, revise your consuming systems to start doing so for future debugging.
I did remove one of the devices from the application in TTN and installed it in another platform (not TTN)
here i get data in as expected.
The devices have been working very fine for 2 years until this morning when all stopped.
RSSI was fine, SNR was fine, no battery problems.
Other applications works fine.
What you mean is that all devices quit sending applications messages and decided on their own to send join requests instead.
As explained above, looking at the recent history of what they sent before may help you figure out why.
That all the devices did this at about the same time is indeed suspicious, but it was a decisions made by the devices, not the network. You need to figure out why they decided that.
1 Like
I did now move the devices to another platform, NASYS.
All devices works smothly, so i am quite shure that something whent wrong in the TTN application.
the string can be closed
No.
The only safe conclusion right now is that you still do not understand that the decision to re-join is the responsibility of the node and not the network.
Whatever the actual issue that caused that remains unknown to you, and it’s quite likely that it will fail again in the future for the same reason, leaving you no more aware of the issue then than you are now.
If you want to be prepared, start archiving the metadata of uplinks now, so that when it breaks again you have something meaningful to examine.
I have 2 years of metadata stored for the same purpose.
My conclusion is that after the break -down the devices try to rejoin the platform.
To some extent i guess that the app rejects the device possibly not recognized the port.
When i restarted the device at another platform it joined immediately, so the issue is somewhere else.
One possibility is that there is an issue in the firmware that causes them to crash after a certain amount of time.
Strictly not necessary but it’s a shame you didn’t try a new application with TTN, connecting them to a different platform still leaves many many questions unanswered.
I guess we’ll hear from you in a couple of years time 
1 Like
Then please use that data to answer the specific questions which were asked about it above.
Not only is there no evidence of a break down, by itself, a break down cannot cause a join attempt.
You need to understand why the devices decided to do that.
Your own screen shot shows that TTN accepted the join attempts, but that does not explain why your node’s firmware failed to take the offered sessions, or why it started trying to join in the first place.
A proper LoRaWAN device, even if being ignored, would show a days or at least hours long record of trying increasing spreading factors before it gave up and tried to join - or if not such a record, then a corresponding time gap in expected uplinks.
Most likely in your device firmware, at the outside with a gateway.
Chances are rebooting the node or deleting it from TTN and re-creating it would have made things work, too.
You shook things loose, but you neither determined nor understood the actual problem, and it’s likely to happen again with you none the wiser as to why.
2 Likes
There is no such thing as a port for an OTAA Join. If you’re referring to uplinks being faulty as the device used a specific port, then the same will happen on another network. Also, the device won’t know if TTN rejected a faulty uplink, unless you were using confirmed uplinks, which you should do sparsely.
Confirmed uplink, while a bad idea, is not the only situation.
Ordinary adaptive data rate needs to get a response occasionally or it will decide it has to switch to a higher, slower, longer range spreading factor. And when it has run out of longer range options to ramp to, it will probably eventually give up, declare the link dead, and the firmware may rejoin.
But that should take a while, not just to give up, but also that unless the device was already at the limit of range, to ramp from whatever spreading factor was typically used, up to the last choice of desperation.
And there should be either evidence of that ramping, or evidence of a long period of entirely missing uplink packets.
I guess it’s possible that if a device used confirmed uplink all the time and never got confirmations it might give up in a shorter timeframe, but it really shouldn’t do that.
Which all goes to say we really, really need to see the metadata of the the last few dozen ordinary packets preceding the switch to sending join requests. And also to know if that metadata is in any way different from what the nodes had been doing a week earlier.
metadata_5000.pdf (2.8 MB)
attached a CSV file with a lot of metadata
The metadata is the same as it has always been, the devices has ben operating from the same place for a very long time.
there was 4 devices and they all where placed at four different locations.