Diagnosing unreliable join-accept reception

Since moving from primarily Microchip (RN2903) nodes on AU915, to a variety of nodes (eg. Seeeduino’s RisingHF and mDot’s SX1272) on AS923, I’ve never had reliable joins on TTN. After nearly a year of accepting it, I’ve gone digging for a reason. Here’s what I’ve found:

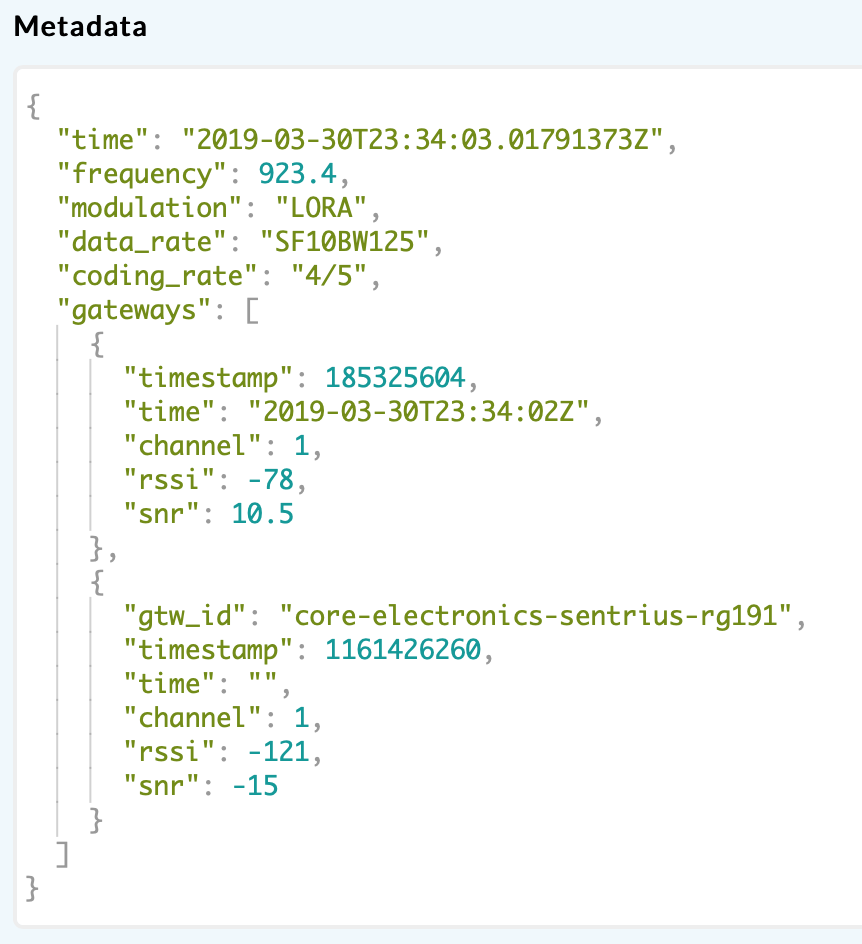
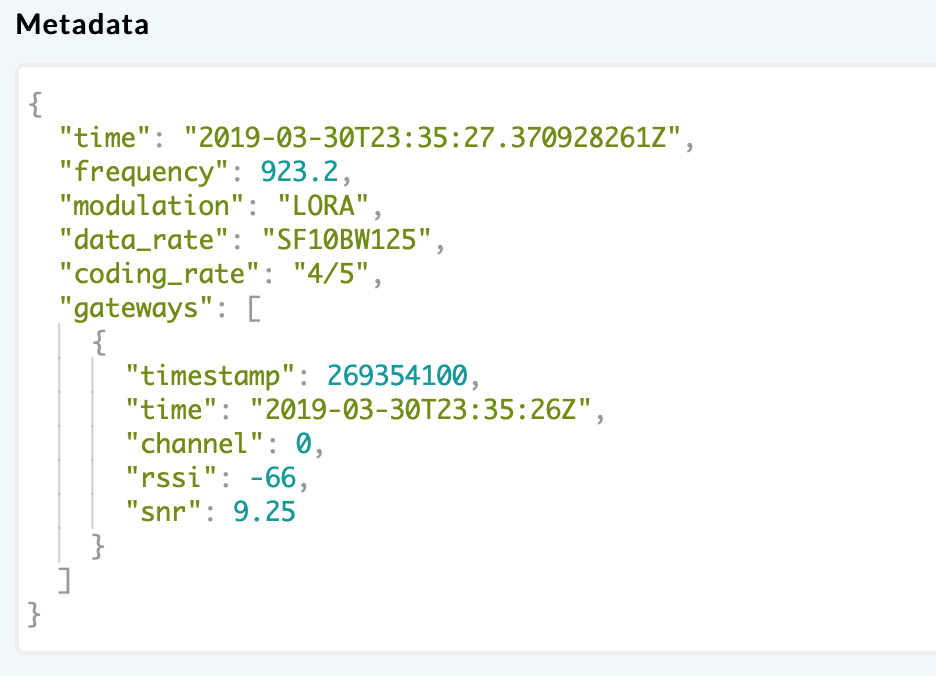
The join-request looks fine, and reaches the Application Server in the console:

40%20am
48%20am

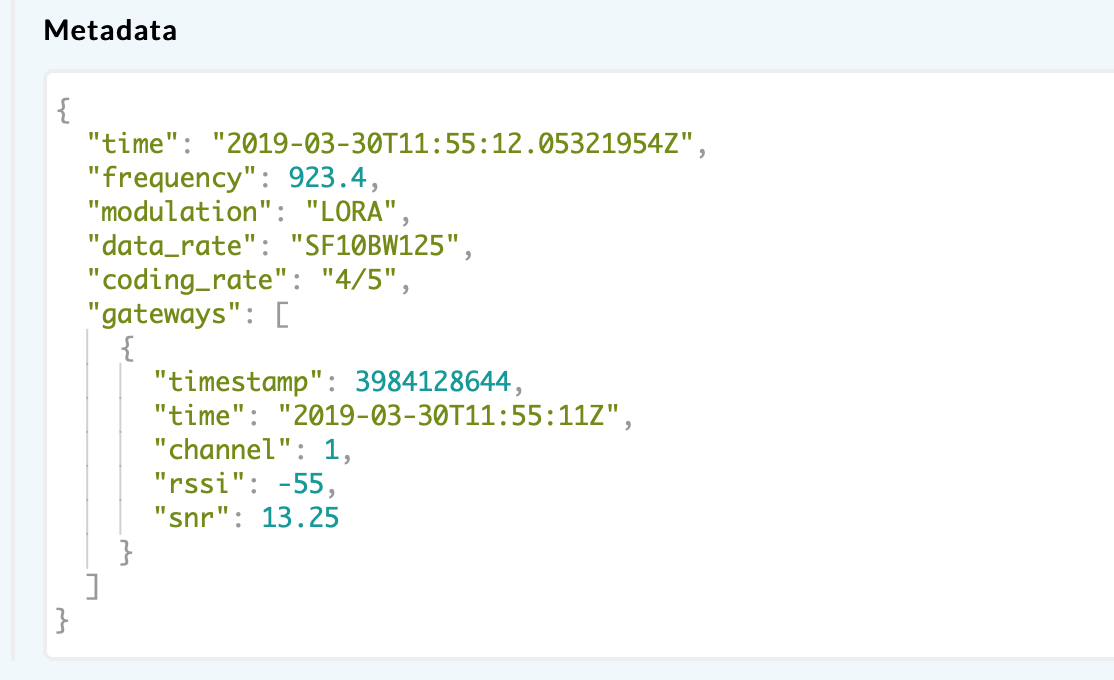
The only strange thing I see is that the gateway’s ID usually doesn’t appear.

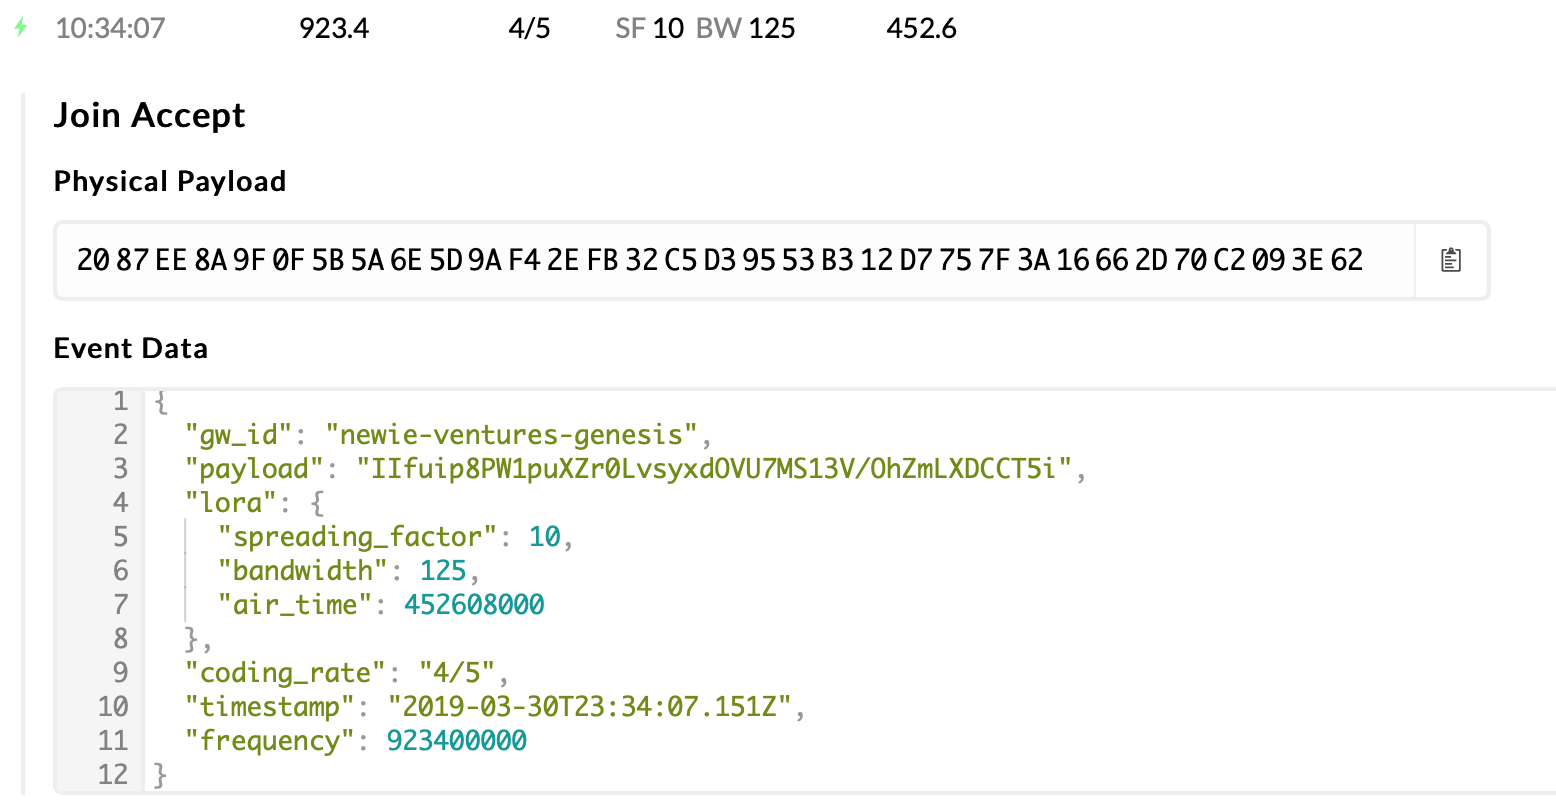
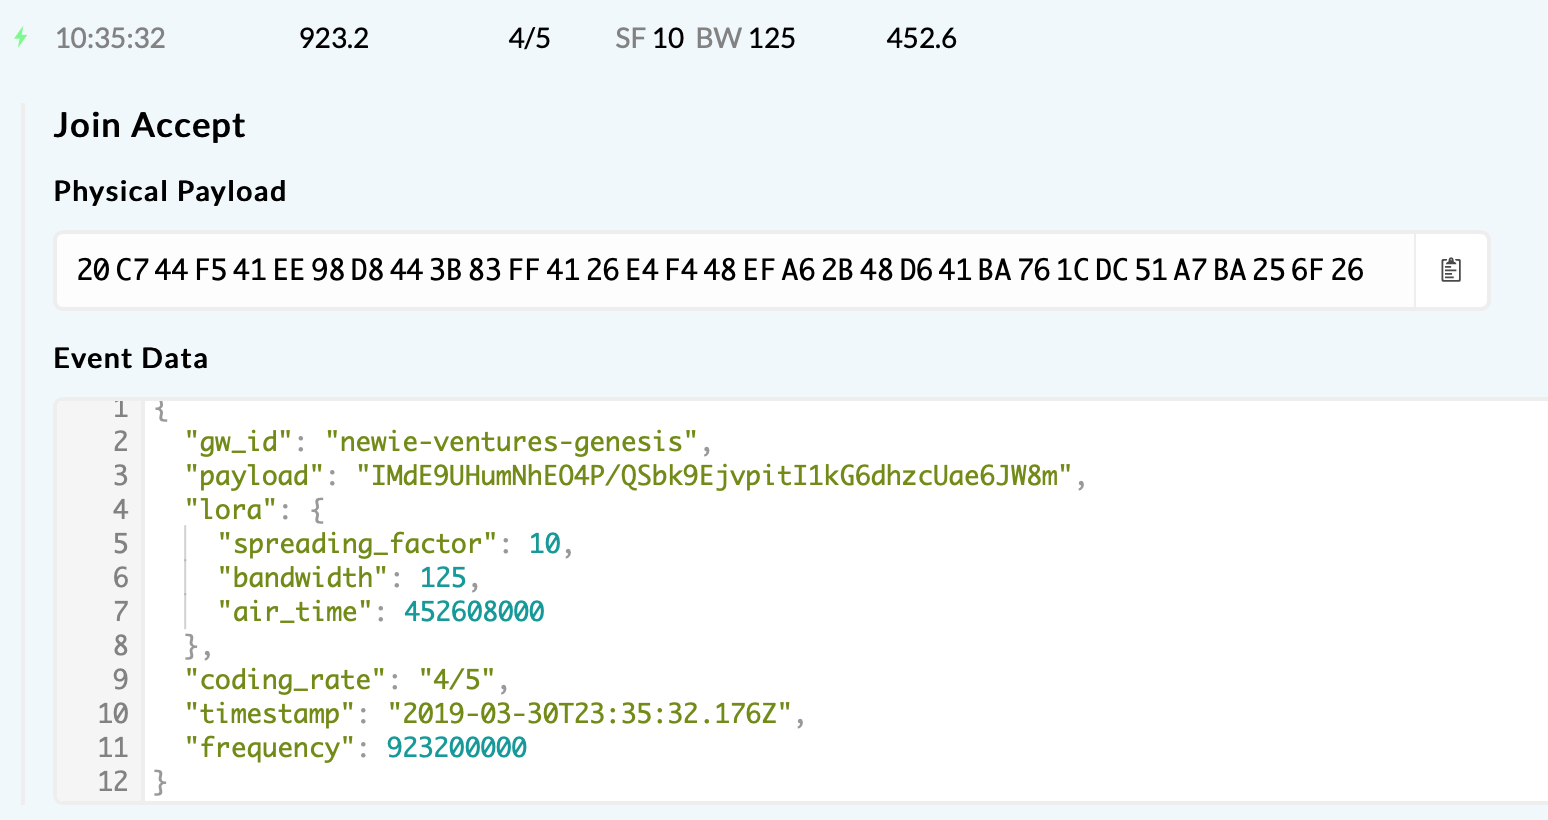
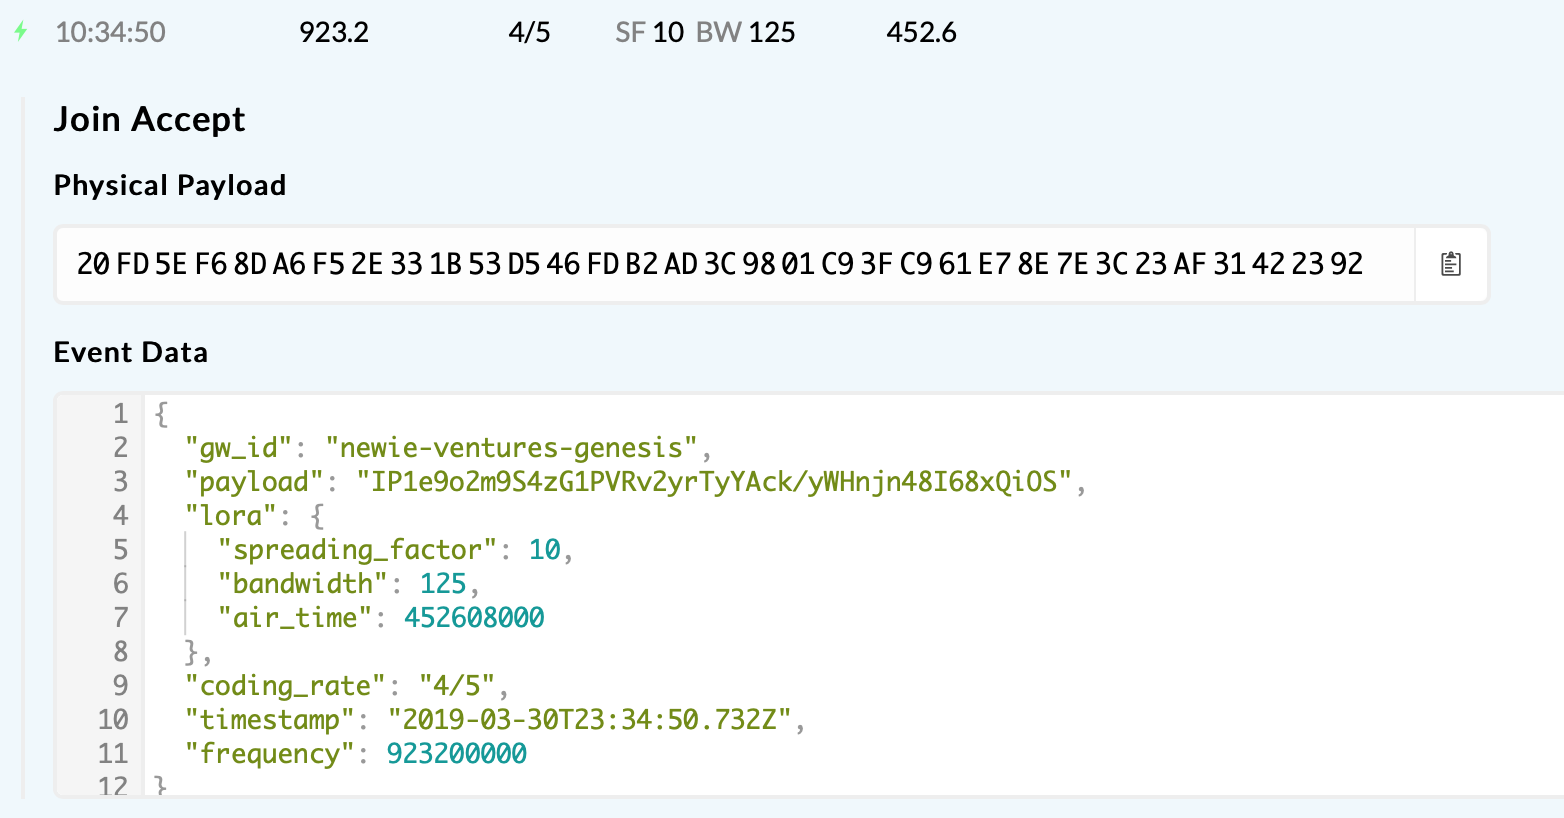
But regardless, the join-accept also looks fine. Here’s how it looks at the gateway console:

13%20am

The gateway itself is a MultiTech Conduit running kersing’s mp-packet-forwarder and it looks to handle the join-accept fine:

22:55:12 INFO: [up] TTN lora packet send to server "thethings.meshed.com.au"
22:55:17 INFO: [down] TTN received downlink with payload
22:55:17 INFO: [TTN] downlink 33 bytes
INFO: Enabling TX notch filter
66.d9.99.a.5f.13.b5.9.0.9a.21.10.0.8.0.0.20.8c.5c.5c.a0.df.e5.50.72.e3.d2.cd.9f.95.6a.14.95.a1.bb.7f.a.9e.4a.bf.d0.3f.48.bd.fb.a3.51.cb.ed.end
INFO: tx_start_delay=1495 (1495.500000) - (1497, bw_delay=1.500000, notch_delay=0.000000)

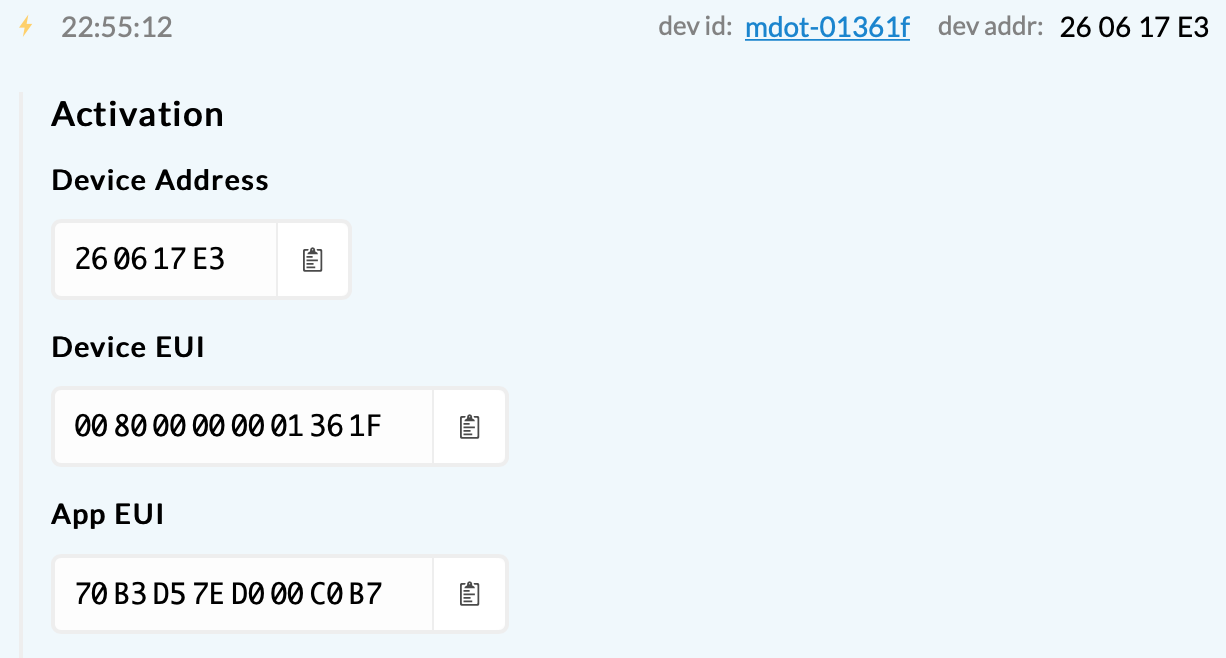
And finally, the mDot itself looks to be behaving correctly:

|2019-03-30 22:55:07|[INFO] =====================|
|---|---|
|2019-03-30 22:55:07|[INFO] general configuration|
|2019-03-30 22:55:07|[INFO] =====================|
|2019-03-30 22:55:07|[INFO] version ------------------ 3.0.0-mbed144|
|2019-03-30 22:55:08|[INFO] device ID/EUI ------------ 008000000001361f|
|2019-03-30 22:55:08|[INFO] default channel plan ----- US915|
|2019-03-30 22:55:08|[INFO] current channel plan ----- AS923|
|2019-03-30 22:55:08|[INFO] public network ----------- on|
|2019-03-30 22:55:08|[INFO] =========================|
|2019-03-30 22:55:08|[INFO] credentials configuration|
|2019-03-30 22:55:08|[INFO] =========================|
|2019-03-30 22:55:08|[INFO] device class ------------- A|
|2019-03-30 22:55:08|[INFO] network join mode -------- AUTO_OTA|
|2019-03-30 22:55:08|[INFO] network name -------------|
|2019-03-30 22:55:08|[INFO] network phrase -----------|
|2019-03-30 22:55:08|[INFO] network EUI -------------- 70b3d57ed000c0b7|
|2019-03-30 22:55:08|[INFO] network KEY -------------- XXX|
|2019-03-30 22:55:08|[INFO] ========================|
|2019-03-30 22:55:08|[INFO] communication parameters|
|2019-03-30 22:55:08|[INFO] ========================|
|2019-03-30 22:55:08|[INFO] acks --------------------- off, 0 attempts|
|2019-03-30 22:55:08|[INFO] TX datarate -------------- DR0|
|2019-03-30 22:55:08|[INFO] TX power ----------------- 20 dBm|
|2019-03-30 22:55:08|[INFO] antenna gain ------------- 3 dBm|
|2019-03-30 22:55:08|[INFO] LBT ---------------------- off|
|2019-03-30 22:55:08|[INFO] ==================|
|2019-03-30 22:55:08|[INFO] receive parameters|
|2019-03-30 22:55:08|[INFO] ==================|
|2019-03-30 22:55:08|[INFO] Join delay --------------- 5 s|
|2019-03-30 22:55:08|[INFO] Join rx1 dr offset ------- 0|
|2019-03-30 22:55:09|[INFO] Join rx2 dr -------------- 2|
|2019-03-30 22:55:09|[INFO] Join rx2 freq ------------ 923200000 Hz|
|2019-03-30 22:55:09|[INFO] Receive delay ------------ 1 s|
|2019-03-30 22:55:09|[INFO] ==================|
|2019-03-30 22:55:10|[INFO] attempt 1 to join network|
|2019-03-30 22:55:10|[INFO] Send join request RxDelay: 5 Rx1Offset: 0 Rx2Freq: 923200000 Rx2Dr: 2|
|2019-03-30 22:55:10|[INFO] Configure radio for TX|
|2019-03-30 22:55:10|[DEBUG] Session pwr: 20 ant: 3 max: 20|
|2019-03-30 22:55:10|[DEBUG] Radio Power index: 16 output: 17 total: 20|
|2019-03-30 22:55:10|[DEBUG] TX PWR: 16 DR: 2 SF: 10 BW: 0 CR: 1 PL: 8 CRC: 1 IQ: 0|
|2019-03-30 22:55:11|[INFO] Configure radio for TX|
|2019-03-30 22:55:11|[DEBUG] Session pwr: 20 ant: 3 max: 20|
|2019-03-30 22:55:11|[DEBUG] Radio Power index: 16 output: 17 total: 20|
|2019-03-30 22:55:11|[DEBUG] TX PWR: 16 DR: 2 SF: 10 BW: 0 CR: 1 PL: 8 CRC: 1 IQ: 0|
|2019-03-30 22:55:11|[DEBUG] Using channel 1 : 923400000|
|2019-03-30 22:55:11|[INFO] Configure radio for TX|
|2019-03-30 22:55:11|[DEBUG] Session pwr: 20 ant: 3 max: 20|
|2019-03-30 22:55:11|[DEBUG] Radio Power index: 16 output: 17 total: 20|
|2019-03-30 22:55:11|[DEBUG] TX PWR: 16 DR: 2 SF: 10 BW: 0 CR: 1 PL: 8 CRC: 1 IQ: 0|
|2019-03-30 22:55:11|[INFO] Configure radio for TX|
|2019-03-30 22:55:11|[DEBUG] Session pwr: 20 ant: 3 max: 20|
|2019-03-30 22:55:11|[DEBUG] Radio Power index: 16 output: 17 total: 20|
|2019-03-30 22:55:11|[DEBUG] TX PWR: 16 DR: 2 SF: 10 BW: 0 CR: 1 PL: 8 CRC: 1 IQ: 0|
|2019-03-30 22:55:11|[DEBUG] update TOE: freq: 923400000 i:0 toa: 370 DC:0|
|2019-03-30 22:55:12|[DEBUG] mDotEvent - TxDone|
|2019-03-30 22:55:17|[INFO] Rx Window 1|
|2019-03-30 22:55:18|[INFO] Rx Window 2|
|2019-03-30 22:55:18|[ERROR] Failed to join network|

I’ve studied the logs intensely and can see that:

  1. The mDot appears to send a well formed join-request with DR 2 (SF10BW125).
  2. Five seconds later the expected gateway sends a well formed join-accept, also with DR 2 (SF10BW125)
  3. The mDot waits the required 5 seconds for the join-accept, but never receives it.

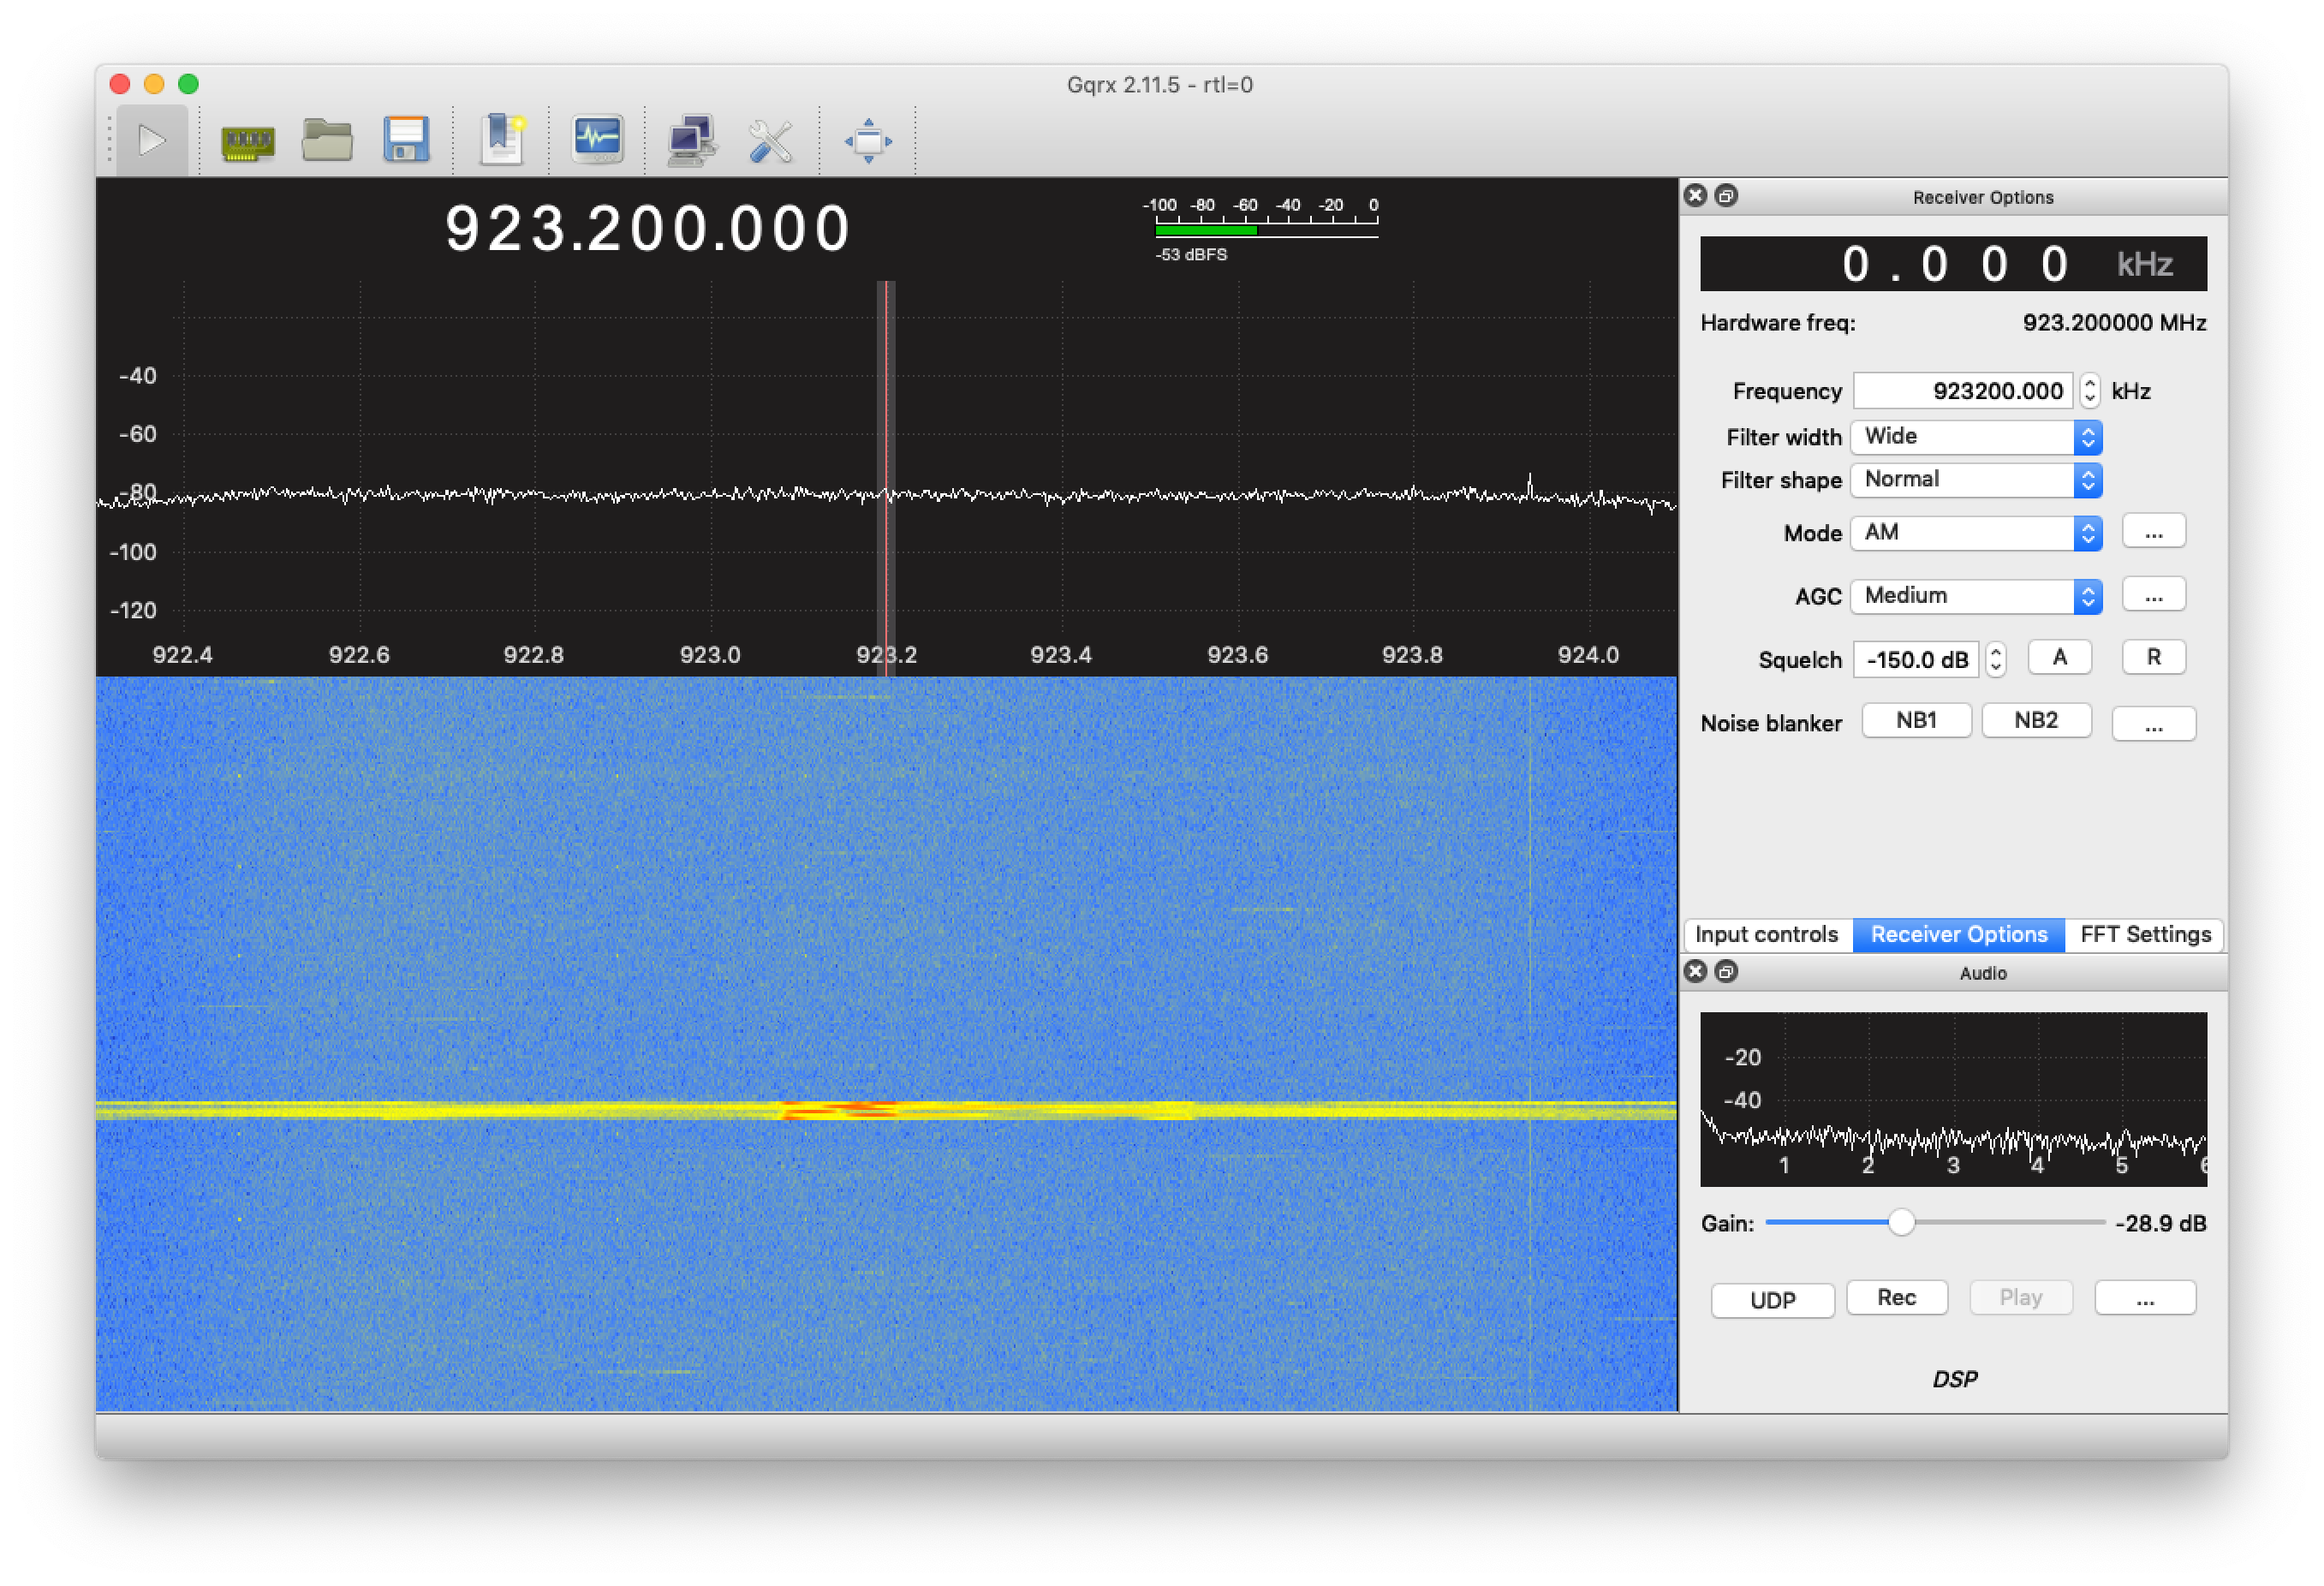
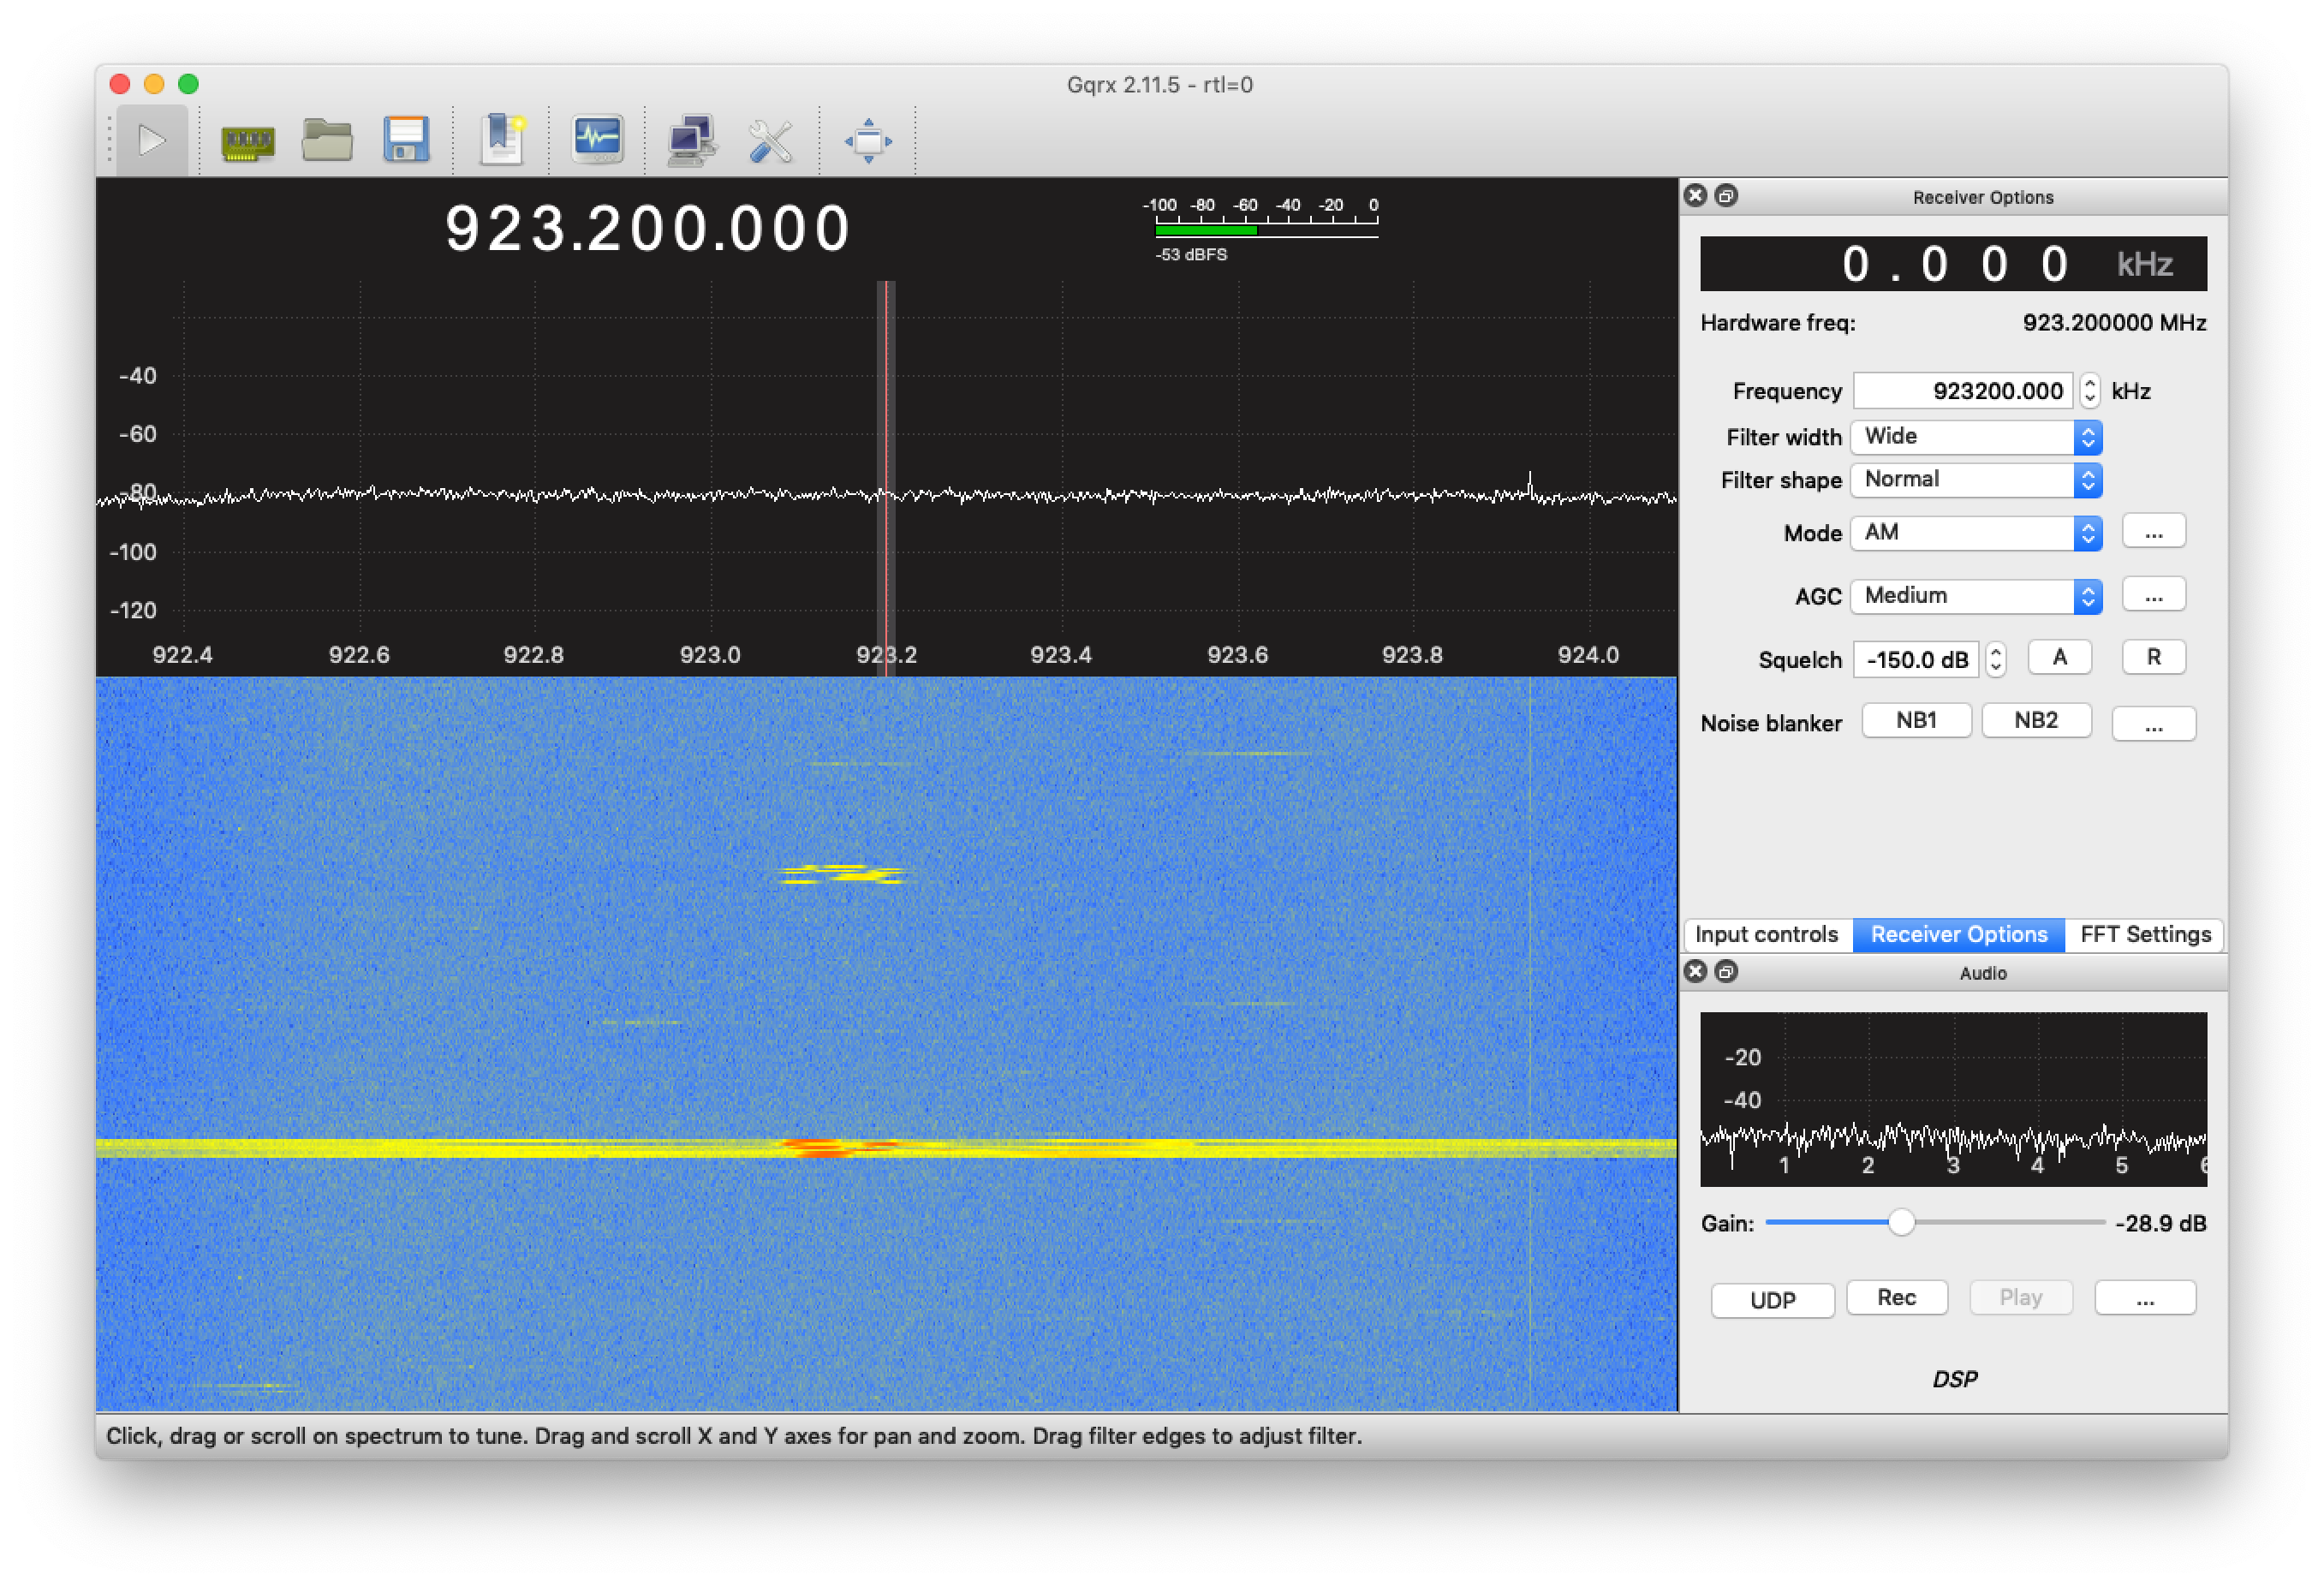
The only potential issue I can see is that the join-request occurs on 923.4MHz while the join-accept is sent on 923.2MHz. I can’t quite tell from Regional Parameters whether this is acceptable or not.

Eventually the join succeeds, somewhere between 1 and 75 attempts later. I haven’t pinned down a successful join yet to compare.

I see there are a lot of threads on unsuccessful joins, even ones about the join-accept never being received, but none of the advice appears to help. I’m generally led to threads on LMiC (such as LMiC does not receive Join Accept) which recommend calling LMIC_setClockError. That led me to generate, capture and carefully compare timestamps, but I couldn’t see any issues. If the issue were the join rx1 window opening a sub-second too early, maybe I wouldn’t see it.

Is there anything I can do to further pin down the issue? What could be going wrong between TTN sending the join-accept and the mDot/Seeeduino receiving it? Are others experiencing similar issues?

FWIW, after a successful join, the first 15 or so ADR downlinks get rejected by the node due to Channel Mask errors. After that they start to apply correctly and the LinkCheckReq messages also start working. Not sure if that’s related.

2 Likes

Just managed to capture a successful join. I note that this time both the join-request and the join-accept were transmitted on 923.2MHz. I can’t see any other differences. Coincidence?

No, that should not happen, and the device will indeed not expect that.

That will happen for RX2, which does not use the same frequency as the uplink, but always uses SF10BW125 on 923.2 MHz. The TTN frequency plan matches the LoRaWAN 1.0.2 regional parameters for AS923:

The RX2 receive window uses a fixed frequency and data rate. The default parameters are 923.2 MHz / DR2 (SF10/125KHz).

If it also happens for RX1: any chance the device is very close to the gateway (say, 3 meters or less), causing cross talk, causing the gateway to see a single join request on multiple frequencies? I know your screenshots do not show that, but still: if that happens, then TTN might select the wrong frequency for the OTAA Join Accept, which the device will then indeed never receive.

1 Like

Thanks for the response. I’m always wary of the “too close” issue, but I don’t think that’s relevant here. There’s at least 8 metres gap through walls, ceiling and roof, and RSSI is around -60dB to -80dB. SNR is typically at least 10 though. And as you suggest, the logs suggest that’s not the issue.

How can I determine whether the packet is destined for the RX1 or RX2 window? I can’t see anything in the packet format that specifies that.

I’ve logged a couple more examples of failure/success. Significantly, this failure example occurs on the same frequency:

Console join-request:

29%20am

Console join-accept:

40%20am

Gateway log:

|2019-03-31 10:34:03|lgw_receive:1165: FIFO content: 1 8f 2 5 17|
|---|---|
|2019-03-31 10:34:03|lgw_receive:1184: [1 17]|
|2019-03-31 10:34:03|Note: LoRa packet|
|2019-03-31 10:34:03|10:34:02  INFO: [stats] received packet with valid CRC from mote: D000C0B7 (fcnt=46037)|
|2019-03-31 10:34:03|10:34:02  INFO: [up] TTN lora packet send to server "thethings.meshed.com.au"|
|2019-03-31 10:34:07|10:34:06  INFO: [down] TTN received downlink with payload|
|2019-03-31 10:34:07|10:34:06  INFO: [TTN] downlink 33 bytes|
|2019-03-31 10:34:08|INFO: Enabling TX notch filter|
|2019-03-31 10:34:08|66.d9.99.b.58.1d.8d.9.0.9a.21.10.0.8.0.0.20.87.ee.8a.9f.f.5b.5a.6e.5d.9a.f4.2e.fb.32.c5.d3.95.53.b3.12.d7.75.7f.3a.16.66.2d.70.c2.9.3e.62.end|

Node:

|2019-03-31 10:34:01|[INFO] attempt 1 to join network|
|---|---|
|2019-03-31 10:34:01|[INFO] Send join request RxDelay: 5 Rx1Offset: 0 Rx2Freq: 923200000 Rx2Dr: 2|
|2019-03-31 10:34:01|[INFO] Configure radio for TX|
|2019-03-31 10:34:01|[DEBUG] Session pwr: 20 ant: 3 max: 20|
|2019-03-31 10:34:01|[DEBUG] Radio Power index: 16 output: 17 total: 20|
|2019-03-31 10:34:01|[DEBUG] TX PWR: 16 DR: 2 SF: 10 BW: 0 CR: 1 PL: 8 CRC: 1 IQ: 0|
|2019-03-31 10:34:01|[INFO] Configure radio for TX|
|2019-03-31 10:34:01|[DEBUG] Session pwr: 20 ant: 3 max: 20|
|2019-03-31 10:34:02|[DEBUG] Radio Power index: 16 output: 17 total: 20|
|2019-03-31 10:34:02|[DEBUG] TX PWR: 16 DR: 2 SF: 10 BW: 0 CR: 1 PL: 8 CRC: 1 IQ: 0|
|2019-03-31 10:34:02|[DEBUG] Using channel 1 : 923400000|
|2019-03-31 10:34:02|[INFO] Configure radio for TX|
|2019-03-31 10:34:02|[DEBUG] Session pwr: 20 ant: 3 max: 20|
|2019-03-31 10:34:02|[DEBUG] Radio Power index: 16 output: 17 total: 20|
|2019-03-31 10:34:02|[DEBUG] TX PWR: 16 DR: 2 SF: 10 BW: 0 CR: 1 PL: 8 CRC: 1 IQ: 0|
|2019-03-31 10:34:02|[INFO] Configure radio for TX|
|2019-03-31 10:34:02|[DEBUG] Session pwr: 20 ant: 3 max: 20|
|2019-03-31 10:34:02|[DEBUG] Radio Power index: 16 output: 17 total: 20|
|2019-03-31 10:34:02|[DEBUG] TX PWR: 16 DR: 2 SF: 10 BW: 0 CR: 1 PL: 8 CRC: 1 IQ: 0|
|2019-03-31 10:34:02|[DEBUG] update TOE: freq: 923400000 i:0 toa: 370 DC:0|
|2019-03-31 10:34:02|[DEBUG] mDotEvent - TxDone|
|2019-03-31 10:34:08|[INFO] Rx Window 1|
|2019-03-31 10:34:09|[INFO] Rx Window 2|
|2019-03-31 10:34:09|[ERROR] Failed to join network|
|2019-03-31 10:34:09|[ERROR] failed to join network -4:Join Error|

And here’s a successful join:

Console join-request:

56%20am

Console join-accept:

08%20am

Gateway log:

2019-03-31 10:35:27 lgw_receive:1165: FIFO content: 1 29 3 5 17
2019-03-31 10:35:27 lgw_receive:1184: [0 17]
2019-03-31 10:35:27 Note: LoRa packet
2019-03-31 10:35:27 10:35:26 INFO: [stats] received packet with valid CRC from mote: D000C0B7 (fcnt=46037)
2019-03-31 10:35:27 10:35:26 INFO: [up] TTN lora packet send to server "thethings.meshed.com.au"
2019-03-31 10:35:32 10:35:31 INFO: [TTN] thethings.meshed.com.au RTT 23
2019-03-31 10:35:32 10:35:31 INFO: [TTN] send status success for thethings.meshed.com.au
2019-03-31 10:35:32 10:35:31 INFO: [down] TTN received downlink with payload
2019-03-31 10:35:32 10:35:31 INFO: [TTN] downlink 33 bytes
2019-03-31 10:35:33 10:35:32 WARNING: a downlink was already scheduled, overwriting it...
2019-03-31 10:35:33 10:35:32 INFO: [jit] lgw_status returned TX_SCHEDULED
2019-03-31 10:35:33 INFO: Enabling TX notch filter
2019-03-31 10:35:33 66.cc.cc.10.69.8c.1d.9.0.9a.21.10.0.8.0.0.20.c7.44.f5.41.ee.98.d8.44.3b.83.ff.41.26.e4.f4.48.ef.a6.2b.48.d6.41.ba.76.1c.dc.51.a7.ba.25.6f.26.end

And node log:

|2019-03-31 10:35:25|[INFO] attempt 3 to join network|
|---|---|
|2019-03-31 10:35:25|[INFO] Send join request RxDelay: 5 Rx1Offset: 0 Rx2Freq: 923200000 Rx2Dr: 2|
|2019-03-31 10:35:25|[INFO] Configure radio for TX|
|2019-03-31 10:35:25|[DEBUG] Session pwr: 20 ant: 3 max: 20|
|2019-03-31 10:35:25|[DEBUG] Radio Power index: 16 output: 17 total: 20|
|2019-03-31 10:35:25|[DEBUG] TX PWR: 16 DR: 2 SF: 10 BW: 0 CR: 1 PL: 8 CRC: 1 IQ: 0|
|2019-03-31 10:35:25|[INFO] Configure radio for TX|
|2019-03-31 10:35:26|[DEBUG] Session pwr: 20 ant: 3 max: 20|
|2019-03-31 10:35:26|[DEBUG] Radio Power index: 16 output: 17 total: 20|
|2019-03-31 10:35:26|[DEBUG] TX PWR: 16 DR: 2 SF: 10 BW: 0 CR: 1 PL: 8 CRC: 1 IQ: 0|
|2019-03-31 10:35:26|[DEBUG] Using channel 0 : 923200000|
|2019-03-31 10:35:26|[INFO] Configure radio for TX|
|2019-03-31 10:35:26|[DEBUG] Session pwr: 20 ant: 3 max: 20|
|2019-03-31 10:35:26|[DEBUG] Radio Power index: 16 output: 17 total: 20|
|2019-03-31 10:35:26|[DEBUG] TX PWR: 16 DR: 2 SF: 10 BW: 0 CR: 1 PL: 8 CRC: 1 IQ: 0|
|2019-03-31 10:35:26|[INFO] Configure radio for TX|
|2019-03-31 10:35:26|[DEBUG] Session pwr: 20 ant: 3 max: 20|
|2019-03-31 10:35:26|[DEBUG] Radio Power index: 16 output: 17 total: 20|
|2019-03-31 10:35:26|[DEBUG] TX PWR: 16 DR: 2 SF: 10 BW: 0 CR: 1 PL: 8 CRC: 1 IQ: 0|
|2019-03-31 10:35:26|[DEBUG] update TOE: freq: 923200000 i:0 toa: 370 DC:0|
|2019-03-31 10:35:27|[DEBUG] mDotEvent - TxDone|
|2019-03-31 10:35:32|[INFO] Rx Window 1|
|2019-03-31 10:35:33|[INFO] Rx Window 2|
|2019-03-31 10:35:33|[INFO] RxDone 33 bytes RSSI: -81 dB SNR: 67 cB|
|2019-03-31 10:35:33|[INFO] Network joined|
|2019-03-31 10:35:33|[DEBUG] Computing session keys...|
|2019-03-31 10:35:33|[DEBUG] DL Settings: 0x02 0x02|
|2019-03-31 10:35:33|[DEBUG] RxOffset: 0 Rx2Index: 2|
|2019-03-31 10:35:33|[DEBUG] mDotEvent - JoinAccept|
|2019-03-31 10:35:33|[INFO] Packet RSSI: -81 dB SNR: 67 cB|
|2019-03-31 10:35:37|[DEBUG] mDotEvent - RxDone|

So now the differentiating factor appears to be:

  • join-request or join-accept sent on 923.4MHz: failure
  • join-request and join-accept sent on 923.2MHz: success

But of course, not enough data yet to be sure. It’s hard work collecting this data, so the evidence is coming in dribbles. Anything else I can check?

Here is another pair of success/failure, which eliminates the 923.2MHz differentiating factors identified in the previous post:

Failure:

55%20am

Success:

08%20am

In both these cases the join-request and join-accept were sent on 923.2MHz.

Looking deeper again, decrypting the two join-accepts gives this:

Failure:

     Payload = 20fd5ef68da6f52e331b53d546fdb2ad3c9801c93fc961e78e7e3c23af31422392
        MHDR = 20
 Join Accept = 4c9aaf130000af220026020170b78c40bf8c10c78ce0ce8cb0d68c002971db83
    AppNonce = af9a4c
       NetID = 000013
     DevAddr = 260022af
  DLSettings = 02
     RXDelay = 01
      CFList = 70b78c40bf8c10c78ce0ce8cb0d68c00
             = decimal 9222000, 9224000, 9226000, 9228000, 9230000; RFU 00
 message MIC = 2971db83
verified MIC = 2971db83

Success:

     Payload = 20c744f541ee98d8443b83ff4126e4f448efa62b48d641ba761cdc51a7ba256f26
        MHDR = 20
 Join Accept = dbf89a130000bc170626020170b78c40bf8c10c78ce0ce8cb0d68c008339d4ec
    AppNonce = 9af8db
       NetID = 000013
     DevAddr = 260617bc
  DLSettings = 02
     RXDelay = 01
      CFList = 70b78c40bf8c10c78ce0ce8cb0d68c00
             = decimal 9222000, 9224000, 9226000, 9228000, 9230000; RFU 00
 message MIC = 8339d4ec
verified MIC = 8339d4ec

Nothing stands out there to me.

So I’m back to square one - it seems for some reason the node is simply does not receive the join-accept sometimes. And I can’t see what that reason is.

Logs were giving me nothing, so I cracked out the SDR. Hallelujah!

See if you can spot the difference.

Failure:

19%20pm

Success:

49%20pm

In the failure scenarios, the join-accept is simply not transmitted over the air! Everything else appears to be the same, so this maybe an issue in the Conduit we’re using as a gateway.

1 Like

Or the command for the downlink is received by the gateway too late to be transmitted. But then some error in the log would have been great…

MP forwarder does log if data is received too late to transmit so if that is the case it should be in the logging.

1 Like

Okay great. What more can I do to diagnose why the Conduit running MP Packet Forwarder is often not transmitting the join-accept over the air?

I note in the logs above that 2019-03-31 10:35:33 10:35:32 WARNING: a downlink was already scheduled, overwriting it... often appears. Could the downlink be being scheduled rather than transmitted?

I tried adding "logger": true to the .conf file but it didn’t seem to make any difference.

If we can crack this it seems we’d be on the verge of cracking many more mysteries, like:

https://www.thethingsnetwork.org/forum/t/most-otaa-join-request-fail-to-downlink-confirmation-to-node/6183

Not the answer you want but might want to post on
http://www.multitech.net/developer/forums/
And you can regsiter with support at https://support.multitech.com/support

Maybe the gateway has reached duty cycle limitations on all usable channels and thus is not transmitting?

Anything that needs to be transmitted is scheduled first in the jit queue.

That isn’t a good sign, it means there is still a packet that should be transmitted queued on the concentrator hardware when the next packet scheduled for transmission is due and the later overwrites the first.

Btw, why link ‘random’ messages regarding join issues like they are all related?

I’m a regular on the MultiTech forums, but I can’t yet formulate a good question. I think I need to get clearer on the issue. Do you think there’s a useful question to ask?

Maybe. I doubt it, because this can occur from a fresh start with little previous gateway activity, but I can’t be sure. Anyway to check?

Great info. Anything I can do to diagnose why the scheduled packet didn’t get transmitted?

Out of the dozens I read, these all looked to have the common features of 1) unsolved, 2) join-accepts not being received, 3) some combination of Conduit, TTN and mDot. In fact, most of them report symptoms along the lines of “join-accept sent by server but not received by node” which is at the heart of the issue here. Whenever I research issues like this, a large part of the effort is in sorting through previous threads looking for commonalities. I really appreciate it when people go to the effort of amalgamating them so efforts can be combined. Given how common these issues are, I was encouraged to think there might be a common cause that could shed light on them all. Do you not agree?

Given how disparate the technologies involved are and the age of the messages (message 1: MultiTech 2016, message 2: Kerlink 2017, message 3: RPi, RFM95 and LMIC, message 4: MultiTech 2016) I don’t see a lot in common except for the description.
Keep in mind the software evolved a lot over the last two years so any information from before the start of 2018 is as good as obsolete because the software involved is no longer being used. (Unless someone is using old software against better judgment)

For the MultiTech forum you will need to run their software stack. That might be a good idea for debugging purposes anyway.

What hardware are you using? Does your hardware support Listen Before Talk because the AS923 frequency plan specifies LBT. LBT might be a cause data is not transmitted if the gateway somehow thinks the channel is not free for transmission… I don’t think the current software build will log anything if LBT prevents transmission. Not sure any logging for this can be enabled as I think this is all done on the concentrator.

LBT is the biggest difference I am aware of between AU915 and AS923 (apart from the obvious difference in frequencies).

1 Like

Ah, good point.

These symptoms are exhibited on a variety of hardware, but this investigation has been with a MultiTech Conduit MTCDT-H5-210A with MTAC-LORA-1.0 card which is of the USB variety (though I haven’t noticed a difference with MTCDT-246A/247A versions) as the gateway and an mDot as the node.

This gateway does not support LBT, so we have to manually set lbt_cfg enable to false to get the AS923 plan from TTN to work.

Anything else I can do to reveal more information at the point the join-accept is scheduled?

Apart from trying the MultiTech software there is nothing I can think of that can easily be implemented for debugging.

Hmm, well I have another interesting data point now:

These results were repeatable on two different Conduit MTCDT-H5-210A with MTAC-LORA-1.0 cards (USB variety).

Today I was unable to repeat the symptoms on a newer Conduit MTCDT-247A with the MTAC-LORA-H card (MTAC-LORA-1.5 SPI versions)! I had 100% successful join-accepts out of a dozen or so attempts.

Interestingly this is with the original 0.31 FPGA firmware and without enabling LBT, so the MP Packet Forwarder config is the same.

So this is surprising, but is looking like an issue with the concentrator on the USB version of the Conduit LoRa cards? Can anyone back that up?

Further, @Maj reported in October last year that v33 and LBT broke downlinks for him. So in summary…

| MTAC-LORA-1.0     | Downlinks broken on AS923 |
| MTAC-LORA-1.5 v31 | Works with LBT disabled   |
| MTAC-LORA-1.5 v33 | Downlinks broken on AS923 |

??

Yes this is sounding all too familiar :). We had some horrendous downlink issues about a year ago and I never really found the cause. Our joins are pretty consistent now, mostly succeeding on the first attempt. Occasionally I’ll see a device try 2-3 times to get a successful join, but this is the exception.

A number of random thoughts from me in case it helps:

  • We use the default v31 FPGA firmware and manually disable LBT in global_config. It’s not required in Australia. It’s nice to have, and we’ll get it enabled one day, but I haven’t had time to look into it further.

  • Test with the built-in Multitech lora-packet-forwarder just to be sure that the issue can’t be traced to mp-pkt-fwd

  • Update the conduit firmware to eliminate that as a source of issues, if you haven’t already.

  • For the older USB LoRa cards (MTAC-LORA-1.0), we’ve succeeded in getting stable downlinks on a group of gateways using Multitech’s gps-pkt-fwd. This is similar to basic-pkt-fwd, but apart from sending GPS location, also sends status messages to the gateway. basic-pkt-fwd, being based on an old version of the spec, does not send status messages, so you’ll see some large “last seen” values on the TTN Console.

  • It’s really hard to tell from logs/messages whether a downlink was sent on RX1 or RX2 or when a queued downlink is overwritten. I believe TTN V3 will be much better at communicating this.

  • I’ve long suspected that an issue with RX2 was causing our downlink issues. I don’t really have any evidence to back up that comment so I may be completely wrong, but I don’t think I’ve ever seen a downlink on RX2 on my SDR - even after trying to force an RX2 downlink. Also I have less hair as a result of diagnosing downlink issues and I’m pretty sure that’s accurate :slight_smile:

HTH
Maj

Just want to throw out three key ideas I’ve been using for debugging a little bit different setup; fortunately one that uses MQTT in between the gateway and network which makes some of this a little less hackery than it would be in a TTN setting, though it should still be possible there.

  • I make my node firmware serial debug output tell me what frequency, SF, etc it is transmitting and receiving on, and I capture this to logfiles I can search back through and see if it matched what the gateway reported or was told to do.

  • I record all RX reports and TX requests going into or out of the gateway (this is easy with MQTT, with other schemes you would need to build some interception logic into some component, or man-in-the-middle the servers). Want to know if a reply is RX1 or RX2? Check the rolling microsecond timestamp of the transmit packet vs. the packet it is replying to. Similarly it should let you see what other transmit request caused a temporal collision. You should also be able to match join accepts in time/frequency back to their join requests which contain the node identity. Granted this is also premised on everything interesting happening through a gateway you control, but for pre-deployment testing putting the node in a metal box will typically reduce the range enough to have that happen.

  • While tuning a tricky case, I blipped a GPIO during the node receive window, put one scope or logic analyzer probe there and got the other probe on the gateway’s transmit LED which is ultimately driven from the SX1301. Nothing like literally capturing the temporal lineup of TX and RX on a storage scope.

1 Like