Thanks for your reply kersing, I have tried deleting and recreating the device and I’m still getting the DevNonces


Thanks for your reply kersing, I have tried deleting and recreating the device and I’m still getting the DevNonces
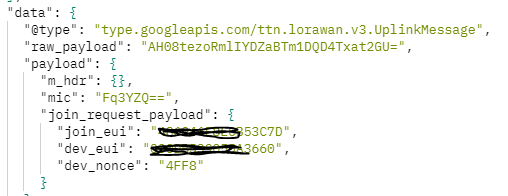
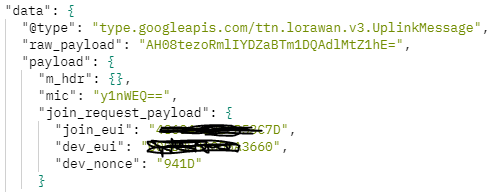
Show the actual contents of the raw packet from the gateway view, or from node debug output.
Particularly, show two successive join requests.
Is it this bit from the gateway you wanted to see cslorabox
What LoRaWAN version have you chosen for your device?
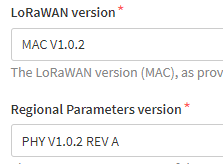
Although I see my other tracker (same make model etc) that is joining was using V1.0.3 so I have updated this to match
THIS SEEMS TO HAVE RESOLVED THE SITUATION
Thanks for pointing me in the right direction, much appreciated.

Don’t post data as pictures - seems your problem may already be solved, but no was is anyone going to re-type a base64 string to interpret it.
Hi,
I also have the same issue where the first initially traffic (i.e. as soon as sensor is turned on) the join accept message is processed.
Then after sometime, I recieve Drop Join Request - DevNonce is already used
When I let it run for a while, i get the following traffic

I have tried recreating the device, changing EUI, changing the MAC from 1.02 to 1.03. I still face the same issue.
Can some one help me on this?
Re-using join nonces is illegal, they need to be unique each time.
Also, post information as text, not pictures - a point just made yesterday in this very thread. Your picture cuts off key information, so we can’t see if your node is using the same nonce over and over, counting, guessing randomly, or what.
I have spoken to a mate, he were monitoring how long the reply (latency) between the join request and the acknowledgment, and this were to high and the nodes “listening” window were closed already.
So now the node does not actually join due the the latency between the gateway and the server.
This device I have created it 5 times in the last 3 days and deleted it, leave it for a hour or two to see if it joins.
Switched it off for an hour, turn it back on.
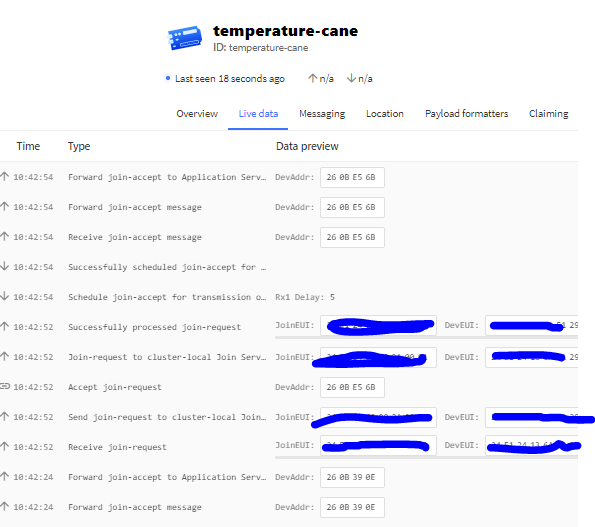
A join request comes in at 10:42:52, is processed and the join accept message is processed and relayed out at 10:42:54.
This leaves ~3 seconds for the message to get to the gateway, for it to process it ready for transmission - which in speed-of-light (almost) terms, is forever.
Latency between the TTN servers and a gateway isn’t really something in the control of TTI, but let’s see some of the details, there may be a solution.
How do you know there is latency between the gateway & the server?
How is the gateway connected to the internet?
Where is the gateway (in the world)?
Which TTN region are you using?
Can we see the gateway console log?
Can we see the gateways own log?
Please post as text. No need to obscure the DevEUI’s, they are transmitted in plain text on a join request anyway.
How do you know there is latency between the gateway & the server? - A mate experienced this from one or two gateways, where the back haul were on GSM (Local provider Vodacom) where it seems the traffic to TTN they were routing it differently than ordinary web traffic, causing high latency , but this is a subject for another day, I still want to experiment with this.
How is the gateway connected to the internet? The one gateway I am routing via I know is on FTTH (fiber) and on ttn-v2-eu-3, the other two I am not sure. of the connection the the net.
"rx_metadata": [
  {
    "gateway_ids": {
      "gateway_id": "packetbroker"
    },
    "packet_broker": {
      "message_id": "01F1HRYPRYQETCQQD34HYSDBH6",
      "forwarder_net_id": "000013",
      "forwarder_tenant_id": "ttn",
      "forwarder_cluster_id": "ttn-v2-eu-3",
      "home_network_net_id": "000013",
      "home_network_tenant_id": "ttn",
      "home_network_cluster_id": "ttn-eu1",
      "hops": [
        {
          "received_at": "2021-03-24T09:27:22.654921833Z",
          "sender_address": "40.113.68.198",
          "receiver_name": "router-dataplane-79957f858b-kvnss",
          "receiver_agent": "pbdataplane/1.4.4 go/1.16.2 linux/amd64"
        },
        {
          "received_at": "2021-03-24T09:27:22.680887336Z",
          "sender_name": "router-dataplane-79957f858b-kvnss",
          "sender_address": "forwarder_uplink",
          "receiver_name": "router-ddf8f9b96-vgdwh",
          "receiver_agent": "pbrouter/1.4.4 go/1.16.2 linux/amd64"
        },
        {
          "received_at": "2021-03-24T09:27:22.692017467Z",
          "sender_name": "router-ddf8f9b96-vgdwh",
          "sender_address": "deliver.000013_ttn_ttn-eu1.uplink",
          "receiver_name": "router-dataplane-79957f858b-kvnss",
          "receiver_agent": "pbdataplane/1.4.4 go/1.16.2 linux/amd64"
        }
      ]
    },
    "rssi": -116,
    "channel_rssi": -116,
    "snr": -7.25,
    "uplink_token": "eyJnIjoiWlhsS2FHSkhZMmxQYVVwQ1RWUkpORkl3VGs1VE1XTnBURU5LYkdKdFRXbFBhVXBDVFZSSk5GSXdUazVKYVhkcFlWaFphVTlwU2pCalZ6VndUak5DU0ZORVZrUk9XRkYzWW01S1JFbHBkMmxrUjBadVNXcHZhVlJHWkVsV2VtUk9WMWhDUkZORVpGcFdTRW94VGpOV1JXVlZNSHBSVTBvNUxteERWMVpvVG5od1FrSlVMVVk1Y1hrdGNsZHVkMmN1YzNOSVJISlROa00xUkRWcGJWbDNSQzQyTmtOR1NFcG5SMnhrYzFGa1RYbFViRkZMUTNReVQxUnZhV05RUWtaNlozWjNUMlpsUlRSUE0xWTBaM1J0ZUhGalgxOWFhVTFOTkZvNWRsRm1ZMUo0YTBadFpVeGpkV3AyTXpaV1pWZGxaMGRCT1RRME1UWkRkVmRHU2tORmRqaGxMVWx2V1V0MVdrZExYMHRGY2tKNGFUWjFjWFoxYVZoNlFtTlFVVlZhVVV3d1ltVlBSSEJsUm1NMlZFUmZjazVaVVVKWmJUbFlOV2xaUlZCVmFYbEJWVXBLUWs5bE0waEVSa05aTGxsYVJGZDNaR2x1TkdSdWJHSmZjbGg0V1hWcFUxRT0iLCJhIjp7ImZuaWQiOiIwMDAwMTMiLCJmdGlkIjoidHRuIiwiZmNpZCI6InR0bi12Mi1ldS0zIn19"
  }
],
"received_at": "2021-03-24T09:27:22.795787684Z",
"correlation_ids": [
  "ns:uplink:01F1HRYPXBN5ZNM52BAARWXAPN",
  "pba:conn:up:01F1FY6KYDWW6Y99H1X9Q1ANCN",
  "pba:uplink:01F1HRYPRYQETCQQD34HYSDBH6",
  "rpc:/ttn.lorawan.v3.GsNs/HandleUplink:01F1HRYPXBPXKCMAS29Q9N4CJV"
],
"device_channel_index": 2,
"consumed_airtime": "0.370688s"
Where is the gateway (in the world)? South Africa
Which TTN region are you using? ttn-v2-eu-3 for the gateway and application https://eu1.cloud.thethings.network/
Can we see the gateway console log?
This is from the gateway I have access to, it is not the closes one ti the node
{
“gw_id”: “eui-323531324d003400”,
“payload”: “AAEAKgDAJOEkgylRahMk4SR3PMGDEq4=”,
“dev_eui”: “24E124136A512983”,
“lora”: {
“spreading_factor”: 10,
“bandwidth”: 125,
“air_time”: 370688000
},
“coding_rate”: “4/5”,
“timestamp”: “2021-03-24T09:32:26.802Z”,
“rssi”: -117,
“snr”: -13.75,
“app_eui”: “24E124C0002A0001”,
“frequency”: 868300000
}
OK, latency total red herring for this issue.
I’ll have to let one of the RF experts comment on the RSSI and SNR but it seems worth trying to get a device & a gateway a bit closer, the airtime isn’t extravagant but it could be that device just can’t quite pickup the join accept or some other activity is causing interference.
Forgot to ask, what is the device?
I have a few Ursalink UC11-t1 at the same sight that do connect, so the RSSI should be good, there are not many nodes in the area, less than 20.
Milesight em300-th
What RSSI / SNR do they report?
    "rssi": -114,
    "channel_rssi": -114,
    "snr": -8.25,
and
      "rssi": -116,
      "channel_rssi": -116,
"snr": -10.75To come back to the original topic - checking the “Reset Frame Counters Enabled” checkbox for ABP seems to work now! 
I have the same issue as you. My device is seen by TTN but never sends any data. The uplink and downlink frame count remains n/a. The raw data although seen is never decoded by the payload formatter. I have added many devices to the things stack but never had this problem. I have tried alot of things to resolve this but no luck. Did you manage to resolve your problem and how did you do it. Any help would be appreciated.
Thanks
Steven
Delete, re-register, delete, re-register and eventual they work, and then after a few days or week they goes MIC Mismatch and then you again delete, re-register, delete, re-register.
I can’t put my finger on it as to what the problem is.
AS this happens to a few different manufactured devices, so seems some where in v3 the stack gets confused.
Hi, I confirm that "“Reset Frame Counters Enabled” checkbox works for ABP when “Frame counter width” set as “32 bit”, but I cannot get it to work when set as “16 bit”.
I would appreciate it if someone could test “16 bit” and see if it worked please?
Thanks.