Downlink on each unconfirmed uplink (ABP)

With my RN2483 modules, I always see a downlink right after each (unconfirmed) uplink.
Using the payload decoder, I get this:

Assuming base64-encoded packet
YHdcCyYKBAAFA9KthAMA/wABsHsMnA==

Message Type = Data
  PHYPayload = 60775C0B260A04000503D2AD840300FF0001B07B0C9C

( PHYPayload = MHDR[1] | MACPayload[..] | MIC[4] )
        MHDR = 60
  MACPayload = 775C0B260A04000503D2AD840300FF0001
         MIC = B07B0C9C

( MACPayload = FHDR | FPort | FRMPayload )
        FHDR = 775C0B260A04000503D2AD840300FF0001
       FPort = 
  FRMPayload = 

      ( FHDR = DevAddr[4] | FCtrl[1] | FCnt[2] | FOpts[0..15] )
     DevAddr = 260B5C77 (Big Endian)
       FCtrl = 0A
        FCnt = 0004 (Big Endian)
       FOpts = 0503D2AD840300FF0001

Message Type = Unconfirmed Data Down
   Direction = down
        FCnt = 4
   FCtrl.ACK = false
   FCtrl.ADR = false

JSON:

"scheduled": {
      "data_rate": {
        "lora": {
          "bandwidth": 125000,
          "spreading_factor": 7
        }
      },
      "coding_rate": "4/5",
      "frequency": "867900000",
      "timestamp": 2990466884,
      "downlink": {
        "tx_power": 16.15,
        "invert_polarization": true
      },
      "concentrator_timestamp": "33055237956000"
    },

Which is sent 1 second after I sent this uplink:

Assuming base64-encoded packet
QHdcCyYABAABj1N+t1XwV5ClRgoYcA==

Message Type = Data
  PHYPayload = 40775C0B26000400018F537EB755F05790A5460A1870

( PHYPayload = MHDR[1] | MACPayload[..] | MIC[4] )
        MHDR = 40
  MACPayload = 775C0B26000400018F537EB755F05790A5
         MIC = 460A1870

( MACPayload = FHDR | FPort | FRMPayload )
        FHDR = 775C0B26000400
       FPort = 01
  FRMPayload = 8F537EB755F05790A5

      ( FHDR = DevAddr[4] | FCtrl[1] | FCnt[2] | FOpts[0..15] )
     DevAddr = 260B5C77 (Big Endian)
       FCtrl = 00
        FCnt = 0004 (Big Endian)
       FOpts = 

Message Type = Unconfirmed Data Up
   Direction = up
        FCnt = 4
   FCtrl.ACK = false
   FCtrl.ADR = false

JSON:

settings": {
        "data_rate": {
          "lora": {
            "bandwidth": 125000,
            "spreading_factor": 7
          }
        },
        "coding_rate": "4/5",
        "frequency": "867900000",
        "timestamp": 2985466884
      },

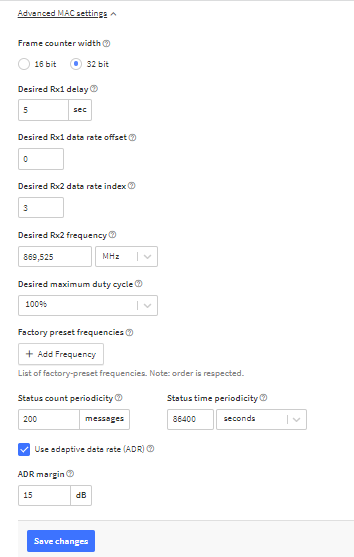
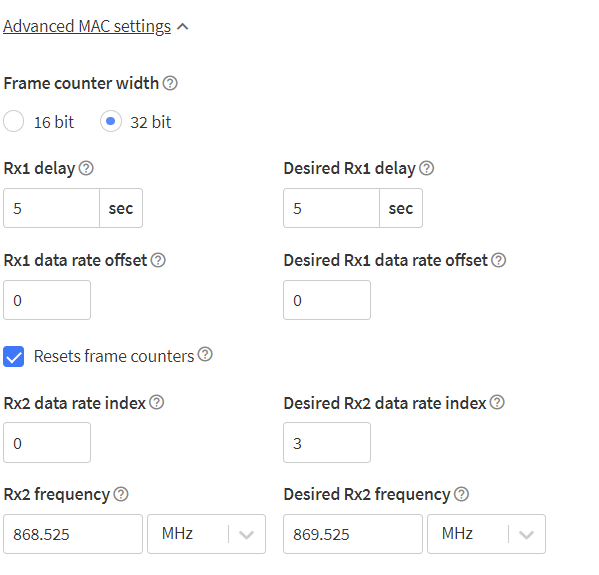
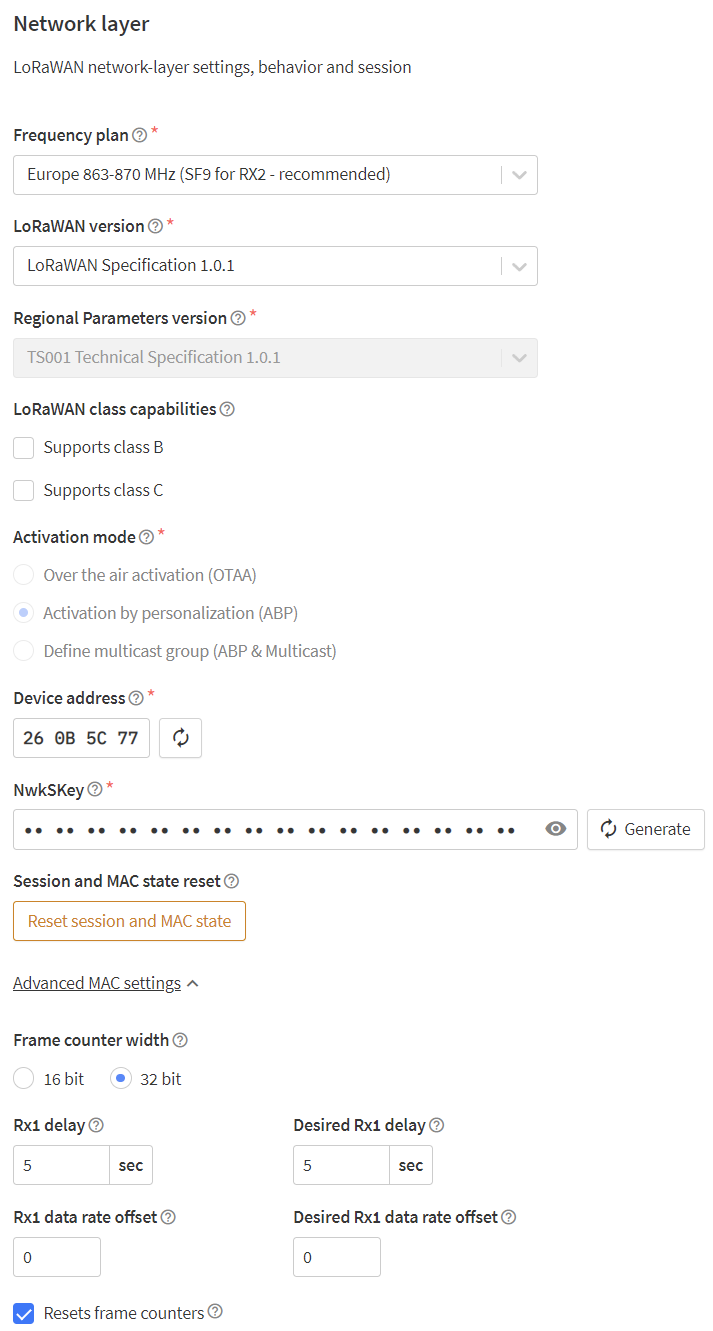
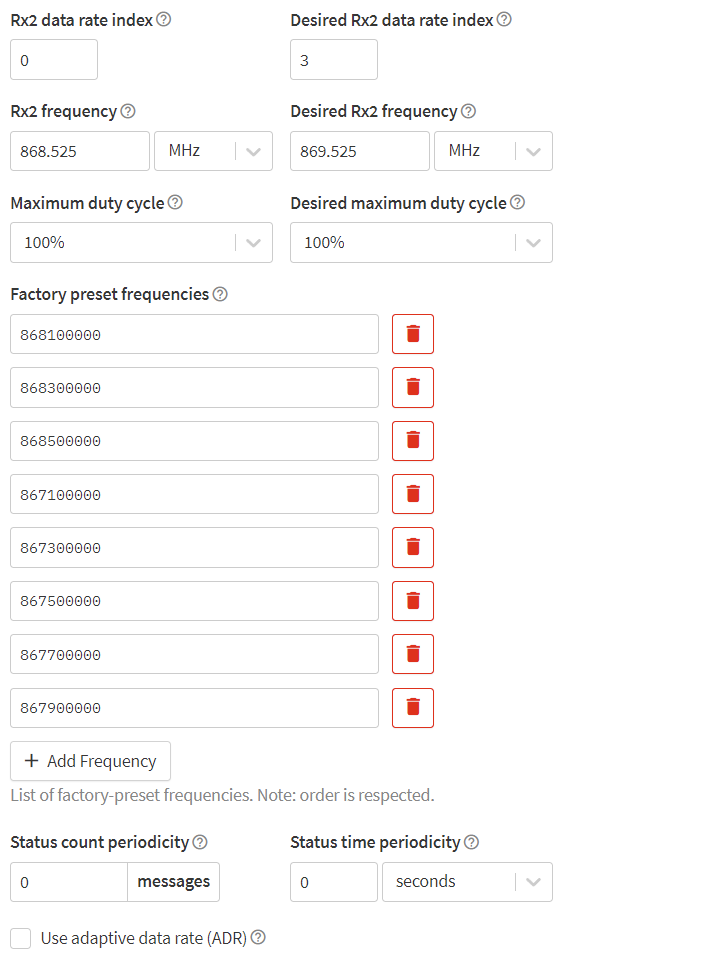
These are the network layer settings for that node in the TTN console:
image
image

And using this in my ESPEasy config:
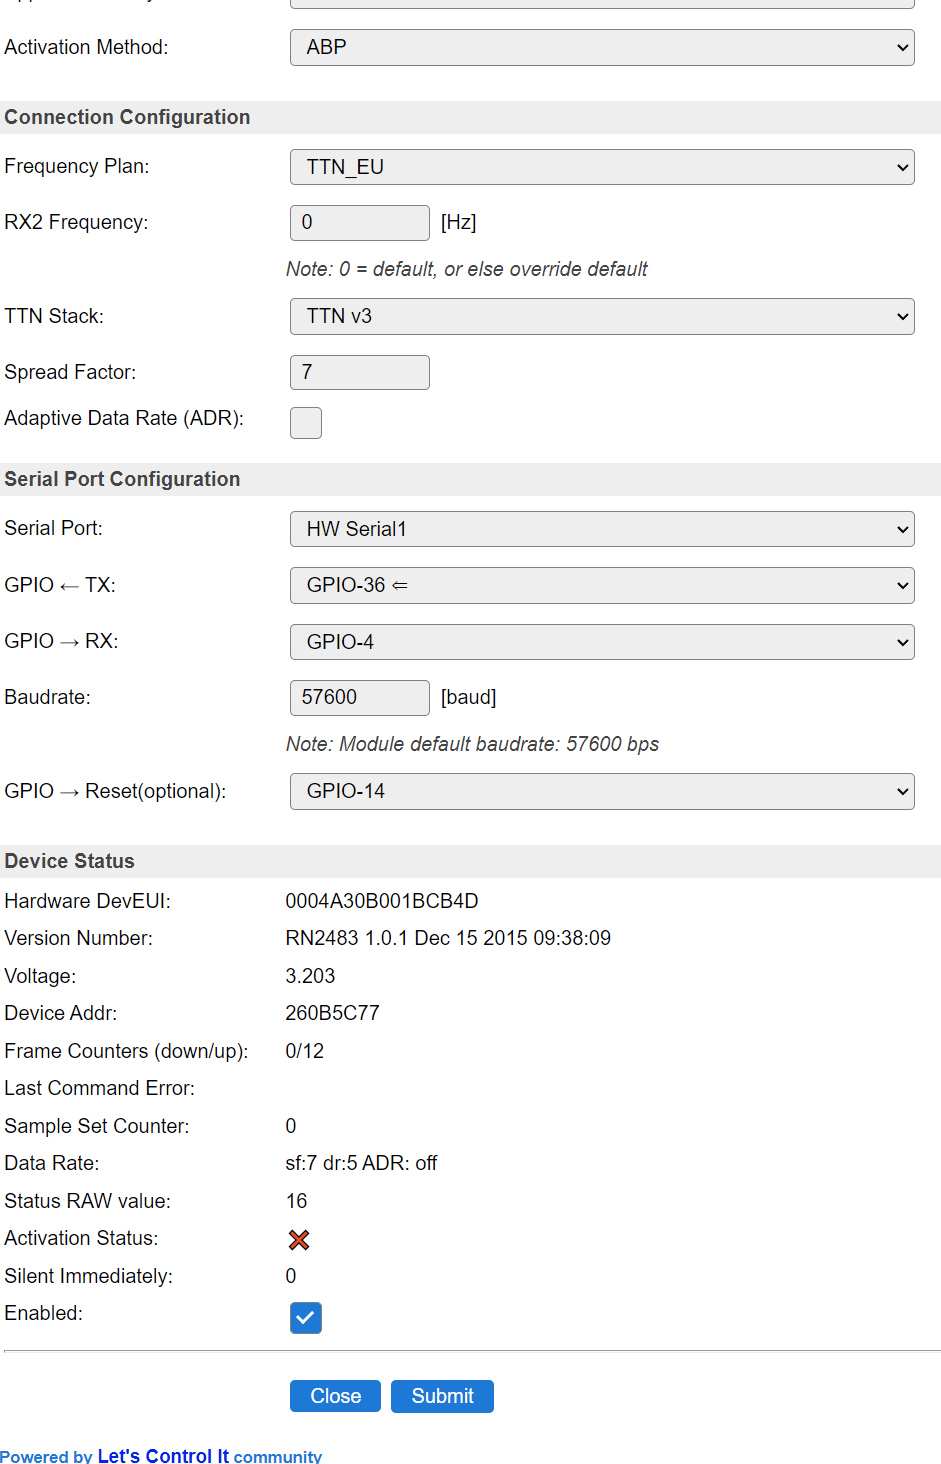
image

The ā€œDevice Statusā€ values at the bottom are all read from the RN2483

Since I do see this reply within a second, I assume it has nothing to do with the RX2, but only with RX1.
One setting which does not appear in the screenshots is the Automatic Reply (mac set ar) which I have also tried to set enabled and disabled (righ now it is enabled)

The same module does work fine with OTAA, so it is capable of receiving data.

Does anyone have an idea of what setting I need to look at to prevent the gateway to send a downlink on every uplink?

1 Like

RN2483 1.0.1 Dec 15 2015ā€¦

Ancient in the context of TTN V3, not even a 2483A? Would suggest start point is update module f/w if poss to latest or atleast >=2H17 and change Network Layer LoRaWAN settings to 1.0.2 (Phy rev B if poss). and see what happens from thereā€¦ may be worth making that change to just see what happensā€¦( I have some old TTN Unos with modules of similar vintage but 2017? f/w that are fine with 1.0.2B)

Well you canā€™t get new modules anywhere these days.
They all seem to be using the very rare element Unobtainium.

So this is an old stash Iā€™ve taken from Jac to help him get rid of old stock :slight_smile:

I will tomorrow test with a basic setting for the LoRaWAN 1.0.2.
If that works, I may have to update the ESPEasy template here on the TTN console too.
Letā€™s hope I will not run into issues with the payload decoder then as current ones are not allowed to be this large anymore.

Iā€™ve also looked into whatā€™s needed to upgrade the firmware and it seems a bit hard to do for those modules already soldered. (and also for those still not yet soldered as I donā€™t seem to have 1.27 mm pogo pins)
So I guess I may need to program it into ESPEasy to flash the firmware too.

This sounds to me like the MAC setting the NS sends to your node.

Lookin in the Live data view for the specific End Device, what is the ā€œTypeā€

image

To change the MAC setting if it is that you need to go the the End Device, General Setting, Network Layer, Advance Mac settings.

But the default settings manages End Devises generally very well and after a few setting changes the NS makes via DownLinks. It should stabilize and you will then see very seldom DownLinks.

image

I did turn off the device after roughly 100 downlinks, not to waste any more air time until this is resolved. In all attempts I guess I may have seen 300-ish downlink packets as replies on my unconfirmed uplinks.
N.B. the distance between my node and the gateway is about 100 meter.

How noisy is the environment? SNR, RSSI, how many gateways in the area, how many nodes.

Well it is about as perfect as can be.
Nearly no other nodes in the area. I only see 2 or 3 LoRaWAN nodes from some other network (KPN?) and only traffic from my own TTN nodes, where I only test 1 at a time.
Every now and then I do see another TTN node with an RSSI of -120 and SNR of 1. (probably a node 10 - 12 km away)

The gateway is mounted at 12m altitude in the transmission tower of a neighbor of mine about 100m (maybe less) and my desk is almost with line-of-sight to the gateway at the 3rd floor (2e etage in Dutch), so about 7m from the ground.

Just one test packet I now did at SF7BW125:

          "gateway_ids": {
            "gateway_id": "tbdev-ten-boer"
          },
          "time": "2022-07-19T22:27:29Z",
          "timestamp": 3402042947,
          "rssi": -77,
          "channel_rssi": -77,
          "snr": 8.75,

I can plugin another gateway if you like.

Edit:
To answer the type of downlink messages:

{
  "name": "gs.down.send",
  "time": "2022-07-19T22:31:29.457791346Z",
  "identifiers": [
    {
      "gateway_ids": {
        "gateway_id": "tbdev-ten-boer"
      }
    }
  ],
  "data": {
    "@type": "type.googleapis.com/ttn.lorawan.v3.DownlinkMessage",
    "raw_payload": "YHdcCyYKCgAFA9KthAMA/wABy1eRHg==",
    "scheduled": {
      "data_rate": {
        "lora": {
          "bandwidth": 125000,
          "spreading_factor": 7
        }
      },
      "coding_rate": "4/5",
      "frequency": "868300000",
      "timestamp": 3647018475,
      "downlink": {
        "tx_power": 16.15,
        "invert_polarization": true
      },
      "concentrator_timestamp": "132496037355000"
    },
    "correlation_ids": [
      "gs:conn:01G88BR7CJQKR0MRK9TE4VX7GW",
      "gs:up:host:01G88BR7CYTEEK0HDHBBWA1CR8",
      "gs:uplink:01G8C9CWGJDKYN0GWPZ5QAHWMJ",
      "ns:downlink:01G8C9CWXH3EV68SQ1EE66YHJ1",
      "ns:transmission:01G8C9CWXHZV58MNF1KGA5SB81",
      "ns:uplink:01G8C9CWGKG5Y8MJ50K5XYR4T7",
      "rpc:/ttn.lorawan.v3.GsNs/HandleUplink:01G8C9CWGKZ48H0PSXJPKKPCPV",
      "rpc:/ttn.lorawan.v3.NsGs/ScheduleDownlink:01G8C9CWXH2ZMR5KN9N080NBQ6"
    ]
  },
  "correlation_ids": [
    "gs:conn:01G88BR7CJQKR0MRK9TE4VX7GW",
    "gs:up:host:01G88BR7CYTEEK0HDHBBWA1CR8",
    "gs:uplink:01G8C9CWGJDKYN0GWPZ5QAHWMJ",
    "ns:downlink:01G8C9CWXH3EV68SQ1EE66YHJ1",
    "ns:transmission:01G8C9CWXHZV58MNF1KGA5SB81",
    "ns:uplink:01G8C9CWGKG5Y8MJ50K5XYR4T7",
    "rpc:/ttn.lorawan.v3.GsNs/HandleUplink:01G8C9CWGKZ48H0PSXJPKKPCPV",
    "rpc:/ttn.lorawan.v3.NsGs/ScheduleDownlink:01G8C9CWXH2ZMR5KN9N080NBQ6"
  ],
  "origin": "ip-10-100-6-46.eu-west-1.compute.internal",
  "context": {
    "tenant-id": "CgN0dG4="
  },
  "visibility": {
    "rights": [
      "RIGHT_GATEWAY_TRAFFIC_READ"
    ]
  },
  "unique_id": "01G8C9CWXHS8XB01P2NPGHTH9A"
}

The Network Server attempts to converge the desired parameters with the current parameters. You can see what MAC command the NS is attempting to send to the end device by enabling verbose logs in the end device event stream of the Console.

Uplink message with verbose enabled:

{
  "name": "gs.up.receive",
  "time": "2022-07-20T11:07:44.836128040Z",
  "identifiers": [
    {
      "gateway_ids": {
        "gateway_id": "tbdev-ten-boer"
      }
    }
  ],
  "data": {
    "@type": "type.googleapis.com/ttn.lorawan.v3.GatewayUplinkMessage",
    "message": {
      "raw_payload": "QHdcCyYAAgABHTKSxZGQVB4KvvEkHw==",
      "payload": {
        "m_hdr": {
          "m_type": "UNCONFIRMED_UP"
        },
        "mic": "vvEkHw==",
        "mac_payload": {
          "f_hdr": {
            "dev_addr": "260B5C77",
            "f_ctrl": {},
            "f_cnt": 2
          },
          "f_port": 1,
          "frm_payload": "HTKSxZGQVB4K"
        }
      },
      "settings": {
        "data_rate": {
          "lora": {
            "bandwidth": 125000,
            "spreading_factor": 7
          }
        },
        "coding_rate": "4/5",
        "frequency": "868500000",
        "timestamp": 1772996251
      },
      "rx_metadata": [
        {
          "gateway_ids": {
            "gateway_id": "tbdev-ten-boer"
          },
          "time": "2022-07-20T11:07:44Z",
          "timestamp": 1772996251,
          "rssi": -78,
          "channel_rssi": -78,
          "snr": 7.25,
          "location": {
            "latitude": 53.278207181133865,
            "longitude": 6.687773903683085,
            "altitude": 12,
            "source": "SOURCE_REGISTRY"
          },
          "uplink_token": "ChIKEAoOdGJkZXYtdGVuLWJvZXIQm423zQYaDAiAxN+WBhCs6c6OAyD4mr/2zLgo"
        }
      ],
      "received_at": "2022-07-20T11:07:44.835957932Z",
      "correlation_ids": [
        "gs:conn:01G88BR7CJQKR0MRK9TE4VX7GW",
        "gs:uplink:01G8DMNMT494YWPVVNNZZK2MPE"
      ]
    },
    "band_id": "EU_863_870"
  },
  "correlation_ids": [
    "gs:conn:01G88BR7CJQKR0MRK9TE4VX7GW",
    "gs:uplink:01G8DMNMT494YWPVVNNZZK2MPE"
  ],
  "origin": "ip-10-100-6-46.eu-west-1.compute.internal",
  "context": {
    "tenant-id": "CgN0dG4="
  },
  "visibility": {
    "rights": [
      "RIGHT_GATEWAY_TRAFFIC_READ"
    ]
  },
  "unique_id": "01G8DMNMT4K11ZT5GMMQYJ9D5P"
}

Here the 2 downlink messages I see with verbose enabled:

Schedule downlink for transmission:

{
  "name": "gs.down.schedule.attempt",
  "time": "2022-07-20T11:07:45.258183706Z",
  "identifiers": [
    {
      "gateway_ids": {
        "gateway_id": "tbdev-ten-boer"
      }
    }
  ],
  "data": {
    "@type": "type.googleapis.com/ttn.lorawan.v3.DownlinkMessage",
    "raw_payload": "YHdcCyYKAgAFA9KthAMA/wAB4siJfA==",
    "request": {
      "rx1_delay": 5,
      "rx1_data_rate": {
        "lora": {
          "bandwidth": 125000,
          "spreading_factor": 7
        }
      },
      "rx1_frequency": "868500000",
      "rx2_data_rate": {
        "lora": {
          "bandwidth": 125000,
          "spreading_factor": 12
        }
      },
      "rx2_frequency": "868525000",
      "priority": "HIGHEST",
      "frequency_plan_id": "EU_863_870_TTN"
    },
    "correlation_ids": [
      "gs:conn:01G88BR7CJQKR0MRK9TE4VX7GW",
      "gs:up:host:01G88BR7CYTEEK0HDHBBWA1CR8",
      "gs:uplink:01G8DMNMT494YWPVVNNZZK2MPE",
      "ns:downlink:01G8DMNN79RF5QYPVXDYYTCXGF",
      "ns:transmission:01G8DMNN793BVJYT9QH5XAN1JM",
      "ns:uplink:01G8DMNMT40B6TY066BCNEFGQM",
      "rpc:/ttn.lorawan.v3.GsNs/HandleUplink:01G8DMNMT4M3ME06RRVYBKGPHP",
      "rpc:/ttn.lorawan.v3.NsGs/ScheduleDownlink:01G8DMNN7ATMB1G6XBFSTZFGCD"
    ]
  },
  "correlation_ids": [
    "gs:conn:01G88BR7CJQKR0MRK9TE4VX7GW",
    "gs:up:host:01G88BR7CYTEEK0HDHBBWA1CR8",
    "gs:uplink:01G8DMNMT494YWPVVNNZZK2MPE",
    "ns:downlink:01G8DMNN79RF5QYPVXDYYTCXGF",
    "ns:transmission:01G8DMNN793BVJYT9QH5XAN1JM",
    "ns:uplink:01G8DMNMT40B6TY066BCNEFGQM",
    "rpc:/ttn.lorawan.v3.GsNs/HandleUplink:01G8DMNMT4M3ME06RRVYBKGPHP",
    "rpc:/ttn.lorawan.v3.NsGs/ScheduleDownlink:01G8DMNN7ATMB1G6XBFSTZFGCD"
  ],
  "origin": "ip-10-100-6-46.eu-west-1.compute.internal",
  "context": {
    "tenant-id": "CgN0dG4="
  },
  "visibility": {
    "rights": [
      "RIGHT_GATEWAY_TRAFFIC_READ"
    ]
  },
  "unique_id": "01G8DMNN7AE59WQ93B6X6ETZF1"
}

Send downlink message:

{
  "name": "gs.down.send",
  "time": "2022-07-20T11:07:45.258285773Z",
  "identifiers": [
    {
      "gateway_ids": {
        "gateway_id": "tbdev-ten-boer"
      }
    }
  ],
  "data": {
    "@type": "type.googleapis.com/ttn.lorawan.v3.DownlinkMessage",
    "raw_payload": "YHdcCyYKAgAFA9KthAMA/wAB4siJfA==",
    "scheduled": {
      "data_rate": {
        "lora": {
          "bandwidth": 125000,
          "spreading_factor": 7
        }
      },
      "coding_rate": "4/5",
      "frequency": "868500000",
      "timestamp": 1777996251,
      "downlink": {
        "tx_power": 16.15,
        "invert_polarization": true
      },
      "concentrator_timestamp": "177871655387000"
    },
    "correlation_ids": [
      "gs:conn:01G88BR7CJQKR0MRK9TE4VX7GW",
      "gs:up:host:01G88BR7CYTEEK0HDHBBWA1CR8",
      "gs:uplink:01G8DMNMT494YWPVVNNZZK2MPE",
      "ns:downlink:01G8DMNN79RF5QYPVXDYYTCXGF",
      "ns:transmission:01G8DMNN793BVJYT9QH5XAN1JM",
      "ns:uplink:01G8DMNMT40B6TY066BCNEFGQM",
      "rpc:/ttn.lorawan.v3.GsNs/HandleUplink:01G8DMNMT4M3ME06RRVYBKGPHP",
      "rpc:/ttn.lorawan.v3.NsGs/ScheduleDownlink:01G8DMNN7ATMB1G6XBFSTZFGCD"
    ]
  },
  "correlation_ids": [
    "gs:conn:01G88BR7CJQKR0MRK9TE4VX7GW",
    "gs:up:host:01G88BR7CYTEEK0HDHBBWA1CR8",
    "gs:uplink:01G8DMNMT494YWPVVNNZZK2MPE",
    "ns:downlink:01G8DMNN79RF5QYPVXDYYTCXGF",
    "ns:transmission:01G8DMNN793BVJYT9QH5XAN1JM",
    "ns:uplink:01G8DMNMT40B6TY066BCNEFGQM",
    "rpc:/ttn.lorawan.v3.GsNs/HandleUplink:01G8DMNMT4M3ME06RRVYBKGPHP",
    "rpc:/ttn.lorawan.v3.NsGs/ScheduleDownlink:01G8DMNN7ATMB1G6XBFSTZFGCD"
  ],
  "origin": "ip-10-100-6-46.eu-west-1.compute.internal",
  "context": {
    "tenant-id": "CgN0dG4="
  },
  "visibility": {
    "rights": [
      "RIGHT_GATEWAY_TRAFFIC_READ"
    ]
  },
  "unique_id": "01G8DMNN7AF3H30A0SF6SYSSFJ"
}

Have you enabled the verbose stream option in the device specific live data view on console?
image

The JSON isnā€™t of much use because it doesnā€™t show what is actually being requested. If you look at the console it usually says what it is trying to set, using the verbose mode as the TTI engineer said:

And once you know what it is trying to set, you can tell the NS that the device already knows this via the CLI or possibly the console and it will stop trying to set it.

However unobtainium or free these devices are, you are jamming the local airwaves & breaching TTN FUP by trying to make them work - so updating them to a far more recent firmware or just accepting they are too geriatric to be worth using could be considered.

Sorry, I took the data from the gateway live data view.

In the devices live data I only see the uplink messages.
This is one of them:

{
  "name": "as.up.data.forward",
  "time": "2022-07-20T11:21:45.007710507Z",
  "identifiers": [
    {
      "device_ids": {
        "device_id": "delbo-weather1",
        "application_ids": {
          "application_id": "espeasy-controller-tder2"
        },
        "dev_addr": "260B5C77"
      }
    }
  ],
  "data": {
    "@type": "type.googleapis.com/ttn.lorawan.v3.ApplicationUp",
    "end_device_ids": {
      "device_id": "delbo-weather1",
      "application_ids": {
        "application_id": "espeasy-controller-tder2"
      },
      "dev_addr": "260B5C77"
    },
    "correlation_ids": [
      "as:up:01G8DNF998AXRPB0PDWWNZ1GGV",
      "gs:conn:01G88BR7CJQKR0MRK9TE4VX7GW",
      "gs:up:host:01G88BR7CYTEEK0HDHBBWA1CR8",
      "gs:uplink:01G8DNF92SQKXJBG1M3SGRDKE2",
      "ns:uplink:01G8DNF92TE32FSZ0ACQ4PNEVF",
      "rpc:/ttn.lorawan.v3.GsNs/HandleUplink:01G8DNF92T4GTRF6264Z2FEXWY",
      "rpc:/ttn.lorawan.v3.NsAs/HandleUplink:01G8DNF997HXBQW0873YQ75PY3"
    ],
    "received_at": "2022-07-20T11:21:45.000862923Z",
    "uplink_message": {
      "f_port": 1,
      "f_cnt": 12,
      "frm_payload": "AgAAAAFg5AIA",
      "decoded_payload": {
        "analog": 18.9536,
        "bytes": [
          2,
          0,
          0,
          0,
          1,
          96,
          228,
          2,
          0
        ],
        "header": {
          "IDX": 0,
          "plugin_id": 2,
          "samplesetcount": 0,
          "valuecount": 1
        },
        "name": "ADC",
        "port": 1
      },
      "rx_metadata": [
        {
          "gateway_ids": {
            "gateway_id": "tbdev-ten-boer"
          },
          "time": "2022-07-20T11:21:44Z",
          "timestamp": 2612986171,
          "rssi": -79,
          "channel_rssi": -79,
          "snr": 7.25,
          "location": {
            "latitude": 53.278207181133865,
            "longitude": 6.687773903683085,
            "altitude": 12,
            "source": "SOURCE_REGISTRY"
          },
          "uplink_token": "ChIKEAoOdGJkZXYtdGVuLWJvZXIQu4L83QkaDAjIyt+WBhCZy636AiD4nPOQhtEo"
        }
      ],
      "settings": {
        "data_rate": {
          "lora": {
            "bandwidth": 125000,
            "spreading_factor": 7
          }
        },
        "coding_rate": "4/5",
        "frequency": "868500000",
        "timestamp": 2612986171
      },
      "received_at": "2022-07-20T11:21:44.794157230Z",
      "consumed_airtime": "0.056576s",
      "version_ids": {
        "brand_id": "espeasy",
        "model_id": "espeasy-rn2483-node-class-a-abp",
        "hardware_version": "_unknown_hw_version_",
        "firmware_version": "1.0.3",
        "band_id": "EU_863_870"
      },
      "network_ids": {
        "net_id": "000013",
        "tenant_id": "ttn",
        "cluster_id": "eu1",
        "cluster_address": "eu1.cloud.thethings.network"
      }
    }
  },
  "correlation_ids": [
    "as:up:01G8DNF998AXRPB0PDWWNZ1GGV",
    "gs:conn:01G88BR7CJQKR0MRK9TE4VX7GW",
    "gs:up:host:01G88BR7CYTEEK0HDHBBWA1CR8",
    "gs:uplink:01G8DNF92SQKXJBG1M3SGRDKE2",
    "ns:uplink:01G8DNF92TE32FSZ0ACQ4PNEVF",
    "rpc:/ttn.lorawan.v3.GsNs/HandleUplink:01G8DNF92T4GTRF6264Z2FEXWY",
    "rpc:/ttn.lorawan.v3.NsAs/HandleUplink:01G8DNF997HXBQW0873YQ75PY3"
  ],
  "origin": "ip-10-100-6-190.eu-west-1.compute.internal",
  "context": {
    "tenant-id": "CgN0dG4="
  },
  "visibility": {
    "rights": [
      "RIGHT_APPLICATION_TRAFFIC_READ"
    ]
  },
  "unique_id": "01G8DNF99FN97ZYVVHFR3N0NFX"
}
  1. Thatā€™s JSON, see above
  2. Itā€™s not a downlink, which is what we need to see, in verbose mode
  3. The problem is about the device, not the gateway ā€¦

Thatā€™s why I want to make sure these units will behave as theyā€™re supposed to do before I let them free in the wild.
Right now these units are only sending data from my desk to debug this situation.
If they canā€™t be made to behave using ABP, I will not deliver them configured to use ABP.

I also found one with 1.0.5 firmware, which I will try later to make sure it is (or isnā€™t) a firmware issue.
Right now, I still leave the option open that Iā€™m the one making the mistakes in any config or code.

Sorry, misunderstood the actual data I needed to grabā€¦

Hopefully this is more useful.

RX parameter setup request:

{
  "name": "ns.mac.rx_param_setup.request",
  "time": "2022-07-20T11:31:45.211635658Z",
  "identifiers": [
    {
      "device_ids": {
        "device_id": "delbo-weather1",
        "application_ids": {
          "application_id": "espeasy-controller-tder2"
        },
        "dev_addr": "260B5C77"
      }
    }
  ],
  "data": {
    "@type": "type.googleapis.com/ttn.lorawan.v3.MACCommand.RxParamSetupReq",
    "rx2_data_rate_index": 3,
    "rx2_frequency": "869525000"
  },
  "correlation_ids": [
    "gs:conn:01G88BR7CJQKR0MRK9TE4VX7GW",
    "gs:up:host:01G88BR7CYTEEK0HDHBBWA1CR8",
    "gs:uplink:01G8DP1K0XJ3MQ3S8803F61EWQ",
    "ns:downlink:01G8DP1KDTF2K6D7DAN6MVKFJR",
    "ns:transmission:01G8DP1KDTFS02CQR433GC5R7Y",
    "ns:uplink:01G8DP1K0YMS4Z6C9T4QB30M5F",
    "rpc:/ttn.lorawan.v3.GsNs/HandleUplink:01G8DP1K0XYSR97YK78B9ZX7K0"
  ],
  "origin": "ip-10-100-7-211.eu-west-1.compute.internal",
  "context": {
    "tenant-id": "CgN0dG4="
  },
  "visibility": {
    "rights": [
      "RIGHT_APPLICATION_TRAFFIC_READ"
    ]
  },
  "unique_id": "01G8DP1KDVXRG6BBNPF91002BX"
}

Link ADR request enqueued:

{
  "name": "ns.mac.link_adr.request",
  "time": "2022-07-20T11:31:45.211639135Z",
  "identifiers": [
    {
      "device_ids": {
        "device_id": "delbo-weather1",
        "application_ids": {
          "application_id": "espeasy-controller-tder2"
        },
        "dev_addr": "260B5C77"
      }
    }
  ],
  "data": {
    "@type": "type.googleapis.com/ttn.lorawan.v3.MACCommand.LinkADRReq",
    "channel_mask": [
      true,
      true,
      true,
      true,
      true,
      true,
      true,
      true,
      false,
      false,
      false,
      false,
      false,
      false,
      false,
      false
    ],
    "nb_trans": 1
  },
  "correlation_ids": [
    "gs:conn:01G88BR7CJQKR0MRK9TE4VX7GW",
    "gs:up:host:01G88BR7CYTEEK0HDHBBWA1CR8",
    "gs:uplink:01G8DP1K0XJ3MQ3S8803F61EWQ",
    "ns:downlink:01G8DP1KDTF2K6D7DAN6MVKFJR",
    "ns:transmission:01G8DP1KDTFS02CQR433GC5R7Y",
    "ns:uplink:01G8DP1K0YMS4Z6C9T4QB30M5F",
    "rpc:/ttn.lorawan.v3.GsNs/HandleUplink:01G8DP1K0XYSR97YK78B9ZX7K0"
  ],
  "origin": "ip-10-100-7-211.eu-west-1.compute.internal",
  "context": {
    "tenant-id": "CgN0dG4="
  },
  "visibility": {
    "rights": [
      "RIGHT_APPLICATION_TRAFFIC_READ"
    ]
  },
  "unique_id": "01G8DP1KDVPV95ZQP6ZJFW4AD7"
}

What I donā€™t get is that ADR is unchecked for this device
but apparently I do see ADR related data.

It seems to suggest to use a data rate of 3 for RX2 and a frequency of 869.525 MHz.
Thatā€™s what I have set here.
But when looking at the device profile, it seems to be set to a data rate of 0 and 868.525 MHz with desired set to 3 and 869ā€¦
Should I configure my device to use ā€œ0ā€ and 868 MHz and then see if it accepts the packet from the gateway?
In other words, is my device template wrong?

N.B. I have tried using 868,525 MHz too, but not yet tried changing the RX2 data rate.

Iā€™d fix one thing at a time and concentrate on the Rx2 issue as it isnā€™t entangled with channel plans.

The NS starts out with DR3 which will compete with your setting of DR0 (the Regional Parameter setting) and whatever you have on the device.

You need to program the device to match what you have set. So what are you telling the device for Rx2?

@adrianmares will explain the ADR as heā€™s already explained it twice to me and Iā€™m just about grasping the details.

Not sure what happened here, but I now have seen several ā€œUpdate end deviceā€ entries where flags are turned on and off without me changing anything in the devices settings.

{
  "name": "ns.end_device.update",
  "time": "2022-07-20T12:02:39.507783557Z",
  "identifiers": [
    {
      "device_ids": {
        "device_id": "delbo-weather1",
        "application_ids": {
          "application_id": "espeasy-controller-tder2"
        }
      }
    }
  ],
  "data": {
    "@type": "type.googleapis.com/google.protobuf.Value",
    "value": [
      "mac_settings.status_count_periodicity",
      "mac_settings.status_time_periodicity",
      "mac_settings.use_adr",
      "mac_settings.desired_max_duty_cycle",
      "mac_settings.max_duty_cycle",
      "mac_settings.supports_32_bit_f_cnt",
      "mac_settings.factory_preset_frequencies",
      "mac_settings.desired_rx2_frequency",
      "mac_settings.rx2_frequency",
      "mac_settings.desired_rx2_data_rate_index",
      "mac_settings.rx2_data_rate_index",
      "mac_settings.resets_f_cnt",
      "mac_settings.desired_rx1_data_rate_offset",
      "mac_settings.rx1_data_rate_offset",
      "mac_settings.desired_rx1_delay",
      "mac_settings.rx1_delay",
      "session.keys.f_nwk_s_int_key.key",
      "supports_class_c",
      "supports_class_b"
    ]
  },
...

I also stopped seeing the downlinks.
image

Did someone else change some settings for me?

I set it to DR3 and 869.525 MHz (thatā€™s what it is set to now)
This is how it shows up in my device settings in the console:
image

The downlink is caused by two drifts and a quirk:

  • The difference in Desired Rx2 data rate index and Rx2 data rate index (3 vs 0) cause the NS to try to change the RX2 data rate index of the end device from 0 to 3 (SF12 to SF9).
    You can fix this by changing the end device MAC settings (setting the desired to 0, which seems to match your end device settings) then resetting the MAC state.
  • The difference in Desired Rx2 frequency and Rx2 frequency causes the NS to try to change the RX2 frequency from 868.525 to 869.525 MHz.
    Changing the (current) RX2 frequency from 868.525 to 869.525 should suffice. 869.525 is the default in the EU868 band (and I expect this device to use it as ā€˜defaultā€™) then resetting the MAC state.

I did the two fixes to the end device for which you posted the logs.

You donā€™t see this in OTAA because the RX2 data rate index and frequency are part of the JoinAccept message of the join procedure, and the end device does not reject it there.

I wouldnā€™t recommend using this end device stack given that it is very old and doesnā€™t seem to be compliant. It will cause headaches down the road.

Regarding the LinkADRReq - this is a mix of two things:

  • LinkADRReq has double use - enable/disable channels in bulk and change the data rate index + transmission power index + number of retransmissions. Disabling ADR disables the later part of the functionality, but the bulk channel enable / disable is still kept, because it is very useful in bands with 72 channels (US-like bands).
  • Disabling ADR via the Console right now has unintended effects (it accidentally enables the manual-ADR mode instead of really disabling it). This will be fixed in a future release.
1 Like