How noisy is the environment? SNR, RSSI, how many gateways in the area, how many nodes.
Well it is about as perfect as can be.
Nearly no other nodes in the area. I only see 2 or 3 LoRaWAN nodes from some other network (KPN?) and only traffic from my own TTN nodes, where I only test 1 at a time.
Every now and then I do see another TTN node with an RSSI of -120 and SNR of 1. (probably a node 10 - 12 km away)
The gateway is mounted at 12m altitude in the transmission tower of a neighbor of mine about 100m (maybe less) and my desk is almost with line-of-sight to the gateway at the 3rd floor (2e etage in Dutch), so about 7m from the ground.
Just one test packet I now did at SF7BW125:
          "gateway_ids": {
            "gateway_id": "tbdev-ten-boer"
          },
          "time": "2022-07-19T22:27:29Z",
          "timestamp": 3402042947,
          "rssi": -77,
          "channel_rssi": -77,
          "snr": 8.75,
I can plugin another gateway if you like.
Edit:
To answer the type of downlink messages:
{
  "name": "gs.down.send",
  "time": "2022-07-19T22:31:29.457791346Z",
  "identifiers": [
    {
      "gateway_ids": {
        "gateway_id": "tbdev-ten-boer"
      }
    }
  ],
  "data": {
    "@type": "type.googleapis.com/ttn.lorawan.v3.DownlinkMessage",
    "raw_payload": "YHdcCyYKCgAFA9KthAMA/wABy1eRHg==",
    "scheduled": {
      "data_rate": {
        "lora": {
          "bandwidth": 125000,
          "spreading_factor": 7
        }
      },
      "coding_rate": "4/5",
      "frequency": "868300000",
      "timestamp": 3647018475,
      "downlink": {
        "tx_power": 16.15,
        "invert_polarization": true
      },
      "concentrator_timestamp": "132496037355000"
    },
    "correlation_ids": [
      "gs:conn:01G88BR7CJQKR0MRK9TE4VX7GW",
      "gs:up:host:01G88BR7CYTEEK0HDHBBWA1CR8",
      "gs:uplink:01G8C9CWGJDKYN0GWPZ5QAHWMJ",
      "ns:downlink:01G8C9CWXH3EV68SQ1EE66YHJ1",
      "ns:transmission:01G8C9CWXHZV58MNF1KGA5SB81",
      "ns:uplink:01G8C9CWGKG5Y8MJ50K5XYR4T7",
      "rpc:/ttn.lorawan.v3.GsNs/HandleUplink:01G8C9CWGKZ48H0PSXJPKKPCPV",
      "rpc:/ttn.lorawan.v3.NsGs/ScheduleDownlink:01G8C9CWXH2ZMR5KN9N080NBQ6"
    ]
  },
  "correlation_ids": [
    "gs:conn:01G88BR7CJQKR0MRK9TE4VX7GW",
    "gs:up:host:01G88BR7CYTEEK0HDHBBWA1CR8",
    "gs:uplink:01G8C9CWGJDKYN0GWPZ5QAHWMJ",
    "ns:downlink:01G8C9CWXH3EV68SQ1EE66YHJ1",
    "ns:transmission:01G8C9CWXHZV58MNF1KGA5SB81",
    "ns:uplink:01G8C9CWGKG5Y8MJ50K5XYR4T7",
    "rpc:/ttn.lorawan.v3.GsNs/HandleUplink:01G8C9CWGKZ48H0PSXJPKKPCPV",
    "rpc:/ttn.lorawan.v3.NsGs/ScheduleDownlink:01G8C9CWXH2ZMR5KN9N080NBQ6"
  ],
  "origin": "ip-10-100-6-46.eu-west-1.compute.internal",
  "context": {
    "tenant-id": "CgN0dG4="
  },
  "visibility": {
    "rights": [
      "RIGHT_GATEWAY_TRAFFIC_READ"
    ]
  },
  "unique_id": "01G8C9CWXHS8XB01P2NPGHTH9A"
}
The Network Server attempts to converge the desired parameters with the current parameters. You can see what MAC command the NS is attempting to send to the end device by enabling verbose logs in the end device event stream of the Console.
Uplink message with verbose enabled:
{
  "name": "gs.up.receive",
  "time": "2022-07-20T11:07:44.836128040Z",
  "identifiers": [
    {
      "gateway_ids": {
        "gateway_id": "tbdev-ten-boer"
      }
    }
  ],
  "data": {
    "@type": "type.googleapis.com/ttn.lorawan.v3.GatewayUplinkMessage",
    "message": {
      "raw_payload": "QHdcCyYAAgABHTKSxZGQVB4KvvEkHw==",
      "payload": {
        "m_hdr": {
          "m_type": "UNCONFIRMED_UP"
        },
        "mic": "vvEkHw==",
        "mac_payload": {
          "f_hdr": {
            "dev_addr": "260B5C77",
            "f_ctrl": {},
            "f_cnt": 2
          },
          "f_port": 1,
          "frm_payload": "HTKSxZGQVB4K"
        }
      },
      "settings": {
        "data_rate": {
          "lora": {
            "bandwidth": 125000,
            "spreading_factor": 7
          }
        },
        "coding_rate": "4/5",
        "frequency": "868500000",
        "timestamp": 1772996251
      },
      "rx_metadata": [
        {
          "gateway_ids": {
            "gateway_id": "tbdev-ten-boer"
          },
          "time": "2022-07-20T11:07:44Z",
          "timestamp": 1772996251,
          "rssi": -78,
          "channel_rssi": -78,
          "snr": 7.25,
          "location": {
            "latitude": 53.278207181133865,
            "longitude": 6.687773903683085,
            "altitude": 12,
            "source": "SOURCE_REGISTRY"
          },
          "uplink_token": "ChIKEAoOdGJkZXYtdGVuLWJvZXIQm423zQYaDAiAxN+WBhCs6c6OAyD4mr/2zLgo"
        }
      ],
      "received_at": "2022-07-20T11:07:44.835957932Z",
      "correlation_ids": [
        "gs:conn:01G88BR7CJQKR0MRK9TE4VX7GW",
        "gs:uplink:01G8DMNMT494YWPVVNNZZK2MPE"
      ]
    },
    "band_id": "EU_863_870"
  },
  "correlation_ids": [
    "gs:conn:01G88BR7CJQKR0MRK9TE4VX7GW",
    "gs:uplink:01G8DMNMT494YWPVVNNZZK2MPE"
  ],
  "origin": "ip-10-100-6-46.eu-west-1.compute.internal",
  "context": {
    "tenant-id": "CgN0dG4="
  },
  "visibility": {
    "rights": [
      "RIGHT_GATEWAY_TRAFFIC_READ"
    ]
  },
  "unique_id": "01G8DMNMT4K11ZT5GMMQYJ9D5P"
}
Here the 2 downlink messages I see with verbose enabled:
Schedule downlink for transmission:
{
  "name": "gs.down.schedule.attempt",
  "time": "2022-07-20T11:07:45.258183706Z",
  "identifiers": [
    {
      "gateway_ids": {
        "gateway_id": "tbdev-ten-boer"
      }
    }
  ],
  "data": {
    "@type": "type.googleapis.com/ttn.lorawan.v3.DownlinkMessage",
    "raw_payload": "YHdcCyYKAgAFA9KthAMA/wAB4siJfA==",
    "request": {
      "rx1_delay": 5,
      "rx1_data_rate": {
        "lora": {
          "bandwidth": 125000,
          "spreading_factor": 7
        }
      },
      "rx1_frequency": "868500000",
      "rx2_data_rate": {
        "lora": {
          "bandwidth": 125000,
          "spreading_factor": 12
        }
      },
      "rx2_frequency": "868525000",
      "priority": "HIGHEST",
      "frequency_plan_id": "EU_863_870_TTN"
    },
    "correlation_ids": [
      "gs:conn:01G88BR7CJQKR0MRK9TE4VX7GW",
      "gs:up:host:01G88BR7CYTEEK0HDHBBWA1CR8",
      "gs:uplink:01G8DMNMT494YWPVVNNZZK2MPE",
      "ns:downlink:01G8DMNN79RF5QYPVXDYYTCXGF",
      "ns:transmission:01G8DMNN793BVJYT9QH5XAN1JM",
      "ns:uplink:01G8DMNMT40B6TY066BCNEFGQM",
      "rpc:/ttn.lorawan.v3.GsNs/HandleUplink:01G8DMNMT4M3ME06RRVYBKGPHP",
      "rpc:/ttn.lorawan.v3.NsGs/ScheduleDownlink:01G8DMNN7ATMB1G6XBFSTZFGCD"
    ]
  },
  "correlation_ids": [
    "gs:conn:01G88BR7CJQKR0MRK9TE4VX7GW",
    "gs:up:host:01G88BR7CYTEEK0HDHBBWA1CR8",
    "gs:uplink:01G8DMNMT494YWPVVNNZZK2MPE",
    "ns:downlink:01G8DMNN79RF5QYPVXDYYTCXGF",
    "ns:transmission:01G8DMNN793BVJYT9QH5XAN1JM",
    "ns:uplink:01G8DMNMT40B6TY066BCNEFGQM",
    "rpc:/ttn.lorawan.v3.GsNs/HandleUplink:01G8DMNMT4M3ME06RRVYBKGPHP",
    "rpc:/ttn.lorawan.v3.NsGs/ScheduleDownlink:01G8DMNN7ATMB1G6XBFSTZFGCD"
  ],
  "origin": "ip-10-100-6-46.eu-west-1.compute.internal",
  "context": {
    "tenant-id": "CgN0dG4="
  },
  "visibility": {
    "rights": [
      "RIGHT_GATEWAY_TRAFFIC_READ"
    ]
  },
  "unique_id": "01G8DMNN7AE59WQ93B6X6ETZF1"
}
Send downlink message:
{
  "name": "gs.down.send",
  "time": "2022-07-20T11:07:45.258285773Z",
  "identifiers": [
    {
      "gateway_ids": {
        "gateway_id": "tbdev-ten-boer"
      }
    }
  ],
  "data": {
    "@type": "type.googleapis.com/ttn.lorawan.v3.DownlinkMessage",
    "raw_payload": "YHdcCyYKAgAFA9KthAMA/wAB4siJfA==",
    "scheduled": {
      "data_rate": {
        "lora": {
          "bandwidth": 125000,
          "spreading_factor": 7
        }
      },
      "coding_rate": "4/5",
      "frequency": "868500000",
      "timestamp": 1777996251,
      "downlink": {
        "tx_power": 16.15,
        "invert_polarization": true
      },
      "concentrator_timestamp": "177871655387000"
    },
    "correlation_ids": [
      "gs:conn:01G88BR7CJQKR0MRK9TE4VX7GW",
      "gs:up:host:01G88BR7CYTEEK0HDHBBWA1CR8",
      "gs:uplink:01G8DMNMT494YWPVVNNZZK2MPE",
      "ns:downlink:01G8DMNN79RF5QYPVXDYYTCXGF",
      "ns:transmission:01G8DMNN793BVJYT9QH5XAN1JM",
      "ns:uplink:01G8DMNMT40B6TY066BCNEFGQM",
      "rpc:/ttn.lorawan.v3.GsNs/HandleUplink:01G8DMNMT4M3ME06RRVYBKGPHP",
      "rpc:/ttn.lorawan.v3.NsGs/ScheduleDownlink:01G8DMNN7ATMB1G6XBFSTZFGCD"
    ]
  },
  "correlation_ids": [
    "gs:conn:01G88BR7CJQKR0MRK9TE4VX7GW",
    "gs:up:host:01G88BR7CYTEEK0HDHBBWA1CR8",
    "gs:uplink:01G8DMNMT494YWPVVNNZZK2MPE",
    "ns:downlink:01G8DMNN79RF5QYPVXDYYTCXGF",
    "ns:transmission:01G8DMNN793BVJYT9QH5XAN1JM",
    "ns:uplink:01G8DMNMT40B6TY066BCNEFGQM",
    "rpc:/ttn.lorawan.v3.GsNs/HandleUplink:01G8DMNMT4M3ME06RRVYBKGPHP",
    "rpc:/ttn.lorawan.v3.NsGs/ScheduleDownlink:01G8DMNN7ATMB1G6XBFSTZFGCD"
  ],
  "origin": "ip-10-100-6-46.eu-west-1.compute.internal",
  "context": {
    "tenant-id": "CgN0dG4="
  },
  "visibility": {
    "rights": [
      "RIGHT_GATEWAY_TRAFFIC_READ"
    ]
  },
  "unique_id": "01G8DMNN7AF3H30A0SF6SYSSFJ"
}
Have you enabled the verbose stream option in the device specific live data view on console?
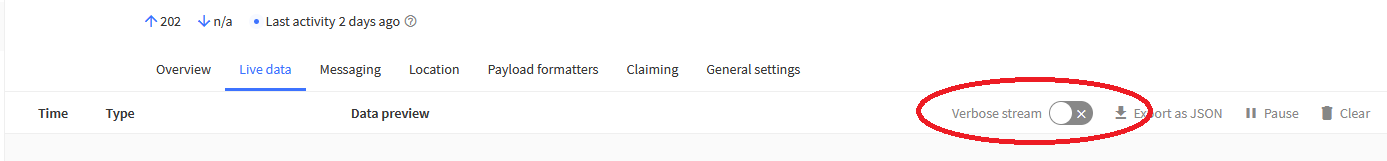
The JSON isn’t of much use because it doesn’t show what is actually being requested. If you look at the console it usually says what it is trying to set, using the verbose mode as the TTI engineer said:
And once you know what it is trying to set, you can tell the NS that the device already knows this via the CLI or possibly the console and it will stop trying to set it.
However unobtainium or free these devices are, you are jamming the local airwaves & breaching TTN FUP by trying to make them work - so updating them to a far more recent firmware or just accepting they are too geriatric to be worth using could be considered.
Sorry, I took the data from the gateway live data view.
In the devices live data I only see the uplink messages.
This is one of them:
{
  "name": "as.up.data.forward",
  "time": "2022-07-20T11:21:45.007710507Z",
  "identifiers": [
    {
      "device_ids": {
        "device_id": "delbo-weather1",
        "application_ids": {
          "application_id": "espeasy-controller-tder2"
        },
        "dev_addr": "260B5C77"
      }
    }
  ],
  "data": {
    "@type": "type.googleapis.com/ttn.lorawan.v3.ApplicationUp",
    "end_device_ids": {
      "device_id": "delbo-weather1",
      "application_ids": {
        "application_id": "espeasy-controller-tder2"
      },
      "dev_addr": "260B5C77"
    },
    "correlation_ids": [
      "as:up:01G8DNF998AXRPB0PDWWNZ1GGV",
      "gs:conn:01G88BR7CJQKR0MRK9TE4VX7GW",
      "gs:up:host:01G88BR7CYTEEK0HDHBBWA1CR8",
      "gs:uplink:01G8DNF92SQKXJBG1M3SGRDKE2",
      "ns:uplink:01G8DNF92TE32FSZ0ACQ4PNEVF",
      "rpc:/ttn.lorawan.v3.GsNs/HandleUplink:01G8DNF92T4GTRF6264Z2FEXWY",
      "rpc:/ttn.lorawan.v3.NsAs/HandleUplink:01G8DNF997HXBQW0873YQ75PY3"
    ],
    "received_at": "2022-07-20T11:21:45.000862923Z",
    "uplink_message": {
      "f_port": 1,
      "f_cnt": 12,
      "frm_payload": "AgAAAAFg5AIA",
      "decoded_payload": {
        "analog": 18.9536,
        "bytes": [
          2,
          0,
          0,
          0,
          1,
          96,
          228,
          2,
          0
        ],
        "header": {
          "IDX": 0,
          "plugin_id": 2,
          "samplesetcount": 0,
          "valuecount": 1
        },
        "name": "ADC",
        "port": 1
      },
      "rx_metadata": [
        {
          "gateway_ids": {
            "gateway_id": "tbdev-ten-boer"
          },
          "time": "2022-07-20T11:21:44Z",
          "timestamp": 2612986171,
          "rssi": -79,
          "channel_rssi": -79,
          "snr": 7.25,
          "location": {
            "latitude": 53.278207181133865,
            "longitude": 6.687773903683085,
            "altitude": 12,
            "source": "SOURCE_REGISTRY"
          },
          "uplink_token": "ChIKEAoOdGJkZXYtdGVuLWJvZXIQu4L83QkaDAjIyt+WBhCZy636AiD4nPOQhtEo"
        }
      ],
      "settings": {
        "data_rate": {
          "lora": {
            "bandwidth": 125000,
            "spreading_factor": 7
          }
        },
        "coding_rate": "4/5",
        "frequency": "868500000",
        "timestamp": 2612986171
      },
      "received_at": "2022-07-20T11:21:44.794157230Z",
      "consumed_airtime": "0.056576s",
      "version_ids": {
        "brand_id": "espeasy",
        "model_id": "espeasy-rn2483-node-class-a-abp",
        "hardware_version": "_unknown_hw_version_",
        "firmware_version": "1.0.3",
        "band_id": "EU_863_870"
      },
      "network_ids": {
        "net_id": "000013",
        "tenant_id": "ttn",
        "cluster_id": "eu1",
        "cluster_address": "eu1.cloud.thethings.network"
      }
    }
  },
  "correlation_ids": [
    "as:up:01G8DNF998AXRPB0PDWWNZ1GGV",
    "gs:conn:01G88BR7CJQKR0MRK9TE4VX7GW",
    "gs:up:host:01G88BR7CYTEEK0HDHBBWA1CR8",
    "gs:uplink:01G8DNF92SQKXJBG1M3SGRDKE2",
    "ns:uplink:01G8DNF92TE32FSZ0ACQ4PNEVF",
    "rpc:/ttn.lorawan.v3.GsNs/HandleUplink:01G8DNF92T4GTRF6264Z2FEXWY",
    "rpc:/ttn.lorawan.v3.NsAs/HandleUplink:01G8DNF997HXBQW0873YQ75PY3"
  ],
  "origin": "ip-10-100-6-190.eu-west-1.compute.internal",
  "context": {
    "tenant-id": "CgN0dG4="
  },
  "visibility": {
    "rights": [
      "RIGHT_APPLICATION_TRAFFIC_READ"
    ]
  },
  "unique_id": "01G8DNF99FN97ZYVVHFR3N0NFX"
}
- That’s JSON, see above
- It’s not a downlink, which is what we need to see, in verbose mode
- The problem is about the device, not the gateway …
That’s why I want to make sure these units will behave as they’re supposed to do before I let them free in the wild.
Right now these units are only sending data from my desk to debug this situation.
If they can’t be made to behave using ABP, I will not deliver them configured to use ABP.
I also found one with 1.0.5 firmware, which I will try later to make sure it is (or isn’t) a firmware issue.
Right now, I still leave the option open that I’m the one making the mistakes in any config or code.
Sorry, misunderstood the actual data I needed to grab…
Hopefully this is more useful.
RX parameter setup request:
{
  "name": "ns.mac.rx_param_setup.request",
  "time": "2022-07-20T11:31:45.211635658Z",
  "identifiers": [
    {
      "device_ids": {
        "device_id": "delbo-weather1",
        "application_ids": {
          "application_id": "espeasy-controller-tder2"
        },
        "dev_addr": "260B5C77"
      }
    }
  ],
  "data": {
    "@type": "type.googleapis.com/ttn.lorawan.v3.MACCommand.RxParamSetupReq",
    "rx2_data_rate_index": 3,
    "rx2_frequency": "869525000"
  },
  "correlation_ids": [
    "gs:conn:01G88BR7CJQKR0MRK9TE4VX7GW",
    "gs:up:host:01G88BR7CYTEEK0HDHBBWA1CR8",
    "gs:uplink:01G8DP1K0XJ3MQ3S8803F61EWQ",
    "ns:downlink:01G8DP1KDTF2K6D7DAN6MVKFJR",
    "ns:transmission:01G8DP1KDTFS02CQR433GC5R7Y",
    "ns:uplink:01G8DP1K0YMS4Z6C9T4QB30M5F",
    "rpc:/ttn.lorawan.v3.GsNs/HandleUplink:01G8DP1K0XYSR97YK78B9ZX7K0"
  ],
  "origin": "ip-10-100-7-211.eu-west-1.compute.internal",
  "context": {
    "tenant-id": "CgN0dG4="
  },
  "visibility": {
    "rights": [
      "RIGHT_APPLICATION_TRAFFIC_READ"
    ]
  },
  "unique_id": "01G8DP1KDVXRG6BBNPF91002BX"
}
Link ADR request enqueued:
{
  "name": "ns.mac.link_adr.request",
  "time": "2022-07-20T11:31:45.211639135Z",
  "identifiers": [
    {
      "device_ids": {
        "device_id": "delbo-weather1",
        "application_ids": {
          "application_id": "espeasy-controller-tder2"
        },
        "dev_addr": "260B5C77"
      }
    }
  ],
  "data": {
    "@type": "type.googleapis.com/ttn.lorawan.v3.MACCommand.LinkADRReq",
    "channel_mask": [
      true,
      true,
      true,
      true,
      true,
      true,
      true,
      true,
      false,
      false,
      false,
      false,
      false,
      false,
      false,
      false
    ],
    "nb_trans": 1
  },
  "correlation_ids": [
    "gs:conn:01G88BR7CJQKR0MRK9TE4VX7GW",
    "gs:up:host:01G88BR7CYTEEK0HDHBBWA1CR8",
    "gs:uplink:01G8DP1K0XJ3MQ3S8803F61EWQ",
    "ns:downlink:01G8DP1KDTF2K6D7DAN6MVKFJR",
    "ns:transmission:01G8DP1KDTFS02CQR433GC5R7Y",
    "ns:uplink:01G8DP1K0YMS4Z6C9T4QB30M5F",
    "rpc:/ttn.lorawan.v3.GsNs/HandleUplink:01G8DP1K0XYSR97YK78B9ZX7K0"
  ],
  "origin": "ip-10-100-7-211.eu-west-1.compute.internal",
  "context": {
    "tenant-id": "CgN0dG4="
  },
  "visibility": {
    "rights": [
      "RIGHT_APPLICATION_TRAFFIC_READ"
    ]
  },
  "unique_id": "01G8DP1KDVPV95ZQP6ZJFW4AD7"
}
What I don’t get is that ADR is unchecked for this device
but apparently I do see ADR related data.
It seems to suggest to use a data rate of 3 for RX2 and a frequency of 869.525 MHz.
That’s what I have set here.
But when looking at the device profile, it seems to be set to a data rate of 0 and 868.525 MHz with desired set to 3 and 869…
Should I configure my device to use “0” and 868 MHz and then see if it accepts the packet from the gateway?
In other words, is my device template wrong?
N.B. I have tried using 868,525 MHz too, but not yet tried changing the RX2 data rate.
I’d fix one thing at a time and concentrate on the Rx2 issue as it isn’t entangled with channel plans.
The NS starts out with DR3 which will compete with your setting of DR0 (the Regional Parameter setting) and whatever you have on the device.
You need to program the device to match what you have set. So what are you telling the device for Rx2?
@adrianmares will explain the ADR as he’s already explained it twice to me and I’m just about grasping the details.
Not sure what happened here, but I now have seen several “Update end device” entries where flags are turned on and off without me changing anything in the devices settings.
{
  "name": "ns.end_device.update",
  "time": "2022-07-20T12:02:39.507783557Z",
  "identifiers": [
    {
      "device_ids": {
        "device_id": "delbo-weather1",
        "application_ids": {
          "application_id": "espeasy-controller-tder2"
        }
      }
    }
  ],
  "data": {
    "@type": "type.googleapis.com/google.protobuf.Value",
    "value": [
      "mac_settings.status_count_periodicity",
      "mac_settings.status_time_periodicity",
      "mac_settings.use_adr",
      "mac_settings.desired_max_duty_cycle",
      "mac_settings.max_duty_cycle",
      "mac_settings.supports_32_bit_f_cnt",
      "mac_settings.factory_preset_frequencies",
      "mac_settings.desired_rx2_frequency",
      "mac_settings.rx2_frequency",
      "mac_settings.desired_rx2_data_rate_index",
      "mac_settings.rx2_data_rate_index",
      "mac_settings.resets_f_cnt",
      "mac_settings.desired_rx1_data_rate_offset",
      "mac_settings.rx1_data_rate_offset",
      "mac_settings.desired_rx1_delay",
      "mac_settings.rx1_delay",
      "session.keys.f_nwk_s_int_key.key",
      "supports_class_c",
      "supports_class_b"
    ]
  },
...
I also stopped seeing the downlinks.

Did someone else change some settings for me?
I set it to DR3 and 869.525 MHz (that’s what it is set to now)
This is how it shows up in my device settings in the console:
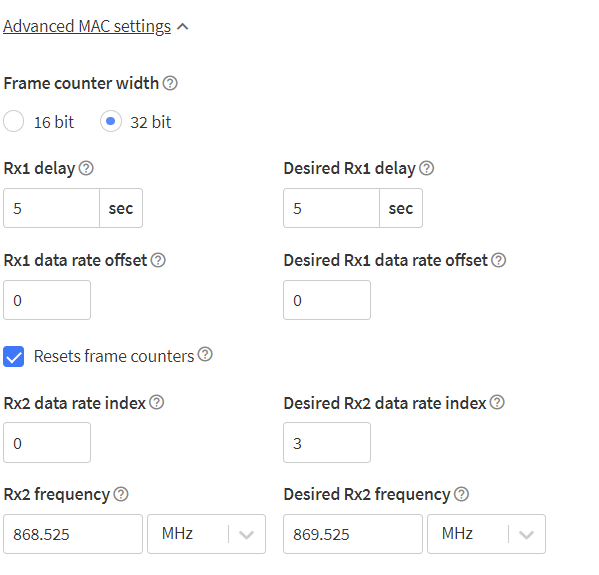
The downlink is caused by two drifts and a quirk:
- The difference in
Desired Rx2 data rate indexandRx2 data rate index(3 vs 0) cause the NS to try to change the RX2 data rate index of the end device from 0 to 3 (SF12 to SF9).
You can fix this by changing the end device MAC settings (setting the desired to 0, which seems to match your end device settings) then resetting the MAC state. - The difference in
Desired Rx2 frequencyandRx2 frequencycauses the NS to try to change the RX2 frequency from 868.525 to 869.525 MHz.
Changing the (current) RX2 frequency from 868.525 to 869.525 should suffice. 869.525 is the default in the EU868 band (and I expect this device to use it as ‘default’) then resetting the MAC state.
I did the two fixes to the end device for which you posted the logs.
You don’t see this in OTAA because the RX2 data rate index and frequency are part of the JoinAccept message of the join procedure, and the end device does not reject it there.
I wouldn’t recommend using this end device stack given that it is very old and doesn’t seem to be compliant. It will cause headaches down the road.
Regarding the LinkADRReq - this is a mix of two things:
-
LinkADRReqhas double use - enable/disable channels in bulk and change the data rate index + transmission power index + number of retransmissions. Disabling ADR disables the later part of the functionality, but the bulk channel enable / disable is still kept, because it is very useful in bands with 72 channels (US-like bands). - Disabling ADR via the Console right now has unintended effects (it accidentally enables the manual-ADR mode instead of really disabling it). This will be fixed in a future release.
1 Like
OK, so this is mainly an issue with the ESPEasy template?
What should I do now? (apart from upgrading the FW)
I guess the preferred settings are: RX2 freq. at 869.525 and Rx2 data rate at DR3
The rest is OK I guess?
Just to be sure, I will also call out all mac get command on an OTAA node to see what is set during OTAA and compare it with the settings I am now using to make sure I don’t miss anything.
I took a bit more time to look at your device and actually it seems that the problematic part is the RX1 delay at boot time. Your device actually never received downlinks because of this mismatch.
If you look at the original picture of your MAC settings that you have posted above, both RX1 delay and Desired RX1 delay were set to 5 seconds, but your firmware I think actually has at boot time RX1 delay set to 1.
After I have edited out your RX1 delay to 1 (second) and resetted the MAC state I finally got responses to the RxTimingSetupReq and RxParamSetupReq, so the end device really is capable of answering these, provided that it hears them out at the right time.
I think that the current settings that are set on your end device should be good. In general I recommend trying to get the boot MAC state of the end device and compare it with the MAC settings - if the parameters don’t match, you get issues like these where the downlinks are sent too late because the end device expects them to arrive 1 second after the uplink, while the Network Server schedules them 5 seconds afterwards.
OK, and what are the “current” settings? After your post I noticed you have made some more changes to them.
So I need to double check that I am setting the correct RX1 delay (code seems to suggest it though) to 5 sec.
RX2 should be DR3 for sure as we want to use SF9 for RX2.
RX2 freq. should be 869.525 MHz (I noticed it is wrong in the ESPEasy template as is (was?) in many others due to an error in the sample config back when the vendor templates were introduced)
Anything else?
I’m not sure the mac state is actually saved on the RN2483 module, so I’m not sure if the module will return in the current state if I power cycle it.
So better to make sure the correct values are set to the module at boot by my software.
N.B. I already made a PR for updating the RX2 frequency for the ESPEasy vendor template.
I will tomorrow look at my code to see why the RX1 delay apparently is not being set at 5 seconds.
I’m also receiving a downlink message on the device when I send an “UNCONFIRMED_UP” message. Some notes:
- the “UNCONFIRMED_UP” type is noted in the uplink json viewer on the gateway and device
- my device live data does NOT show this downlink message
- my gateway shows this downlink message is sent 0.4s after receiving the unconfirmed uplink message as “gs.down.send” and it looks like it’s an unconfirmed down message (starts with 60 in the payload):
60 6a f1 0e 22 8b 00 00 03 30 00 00 71 03 30 00 ff 01 06 ae 80 c9 cb - I get the same behavior when I send a unconfirmed message to the helium network.
It seems to be some kind of complaint response but not sure.