My problem is that I am not getting all the data in my DB that I should.
I have 16 sensors (dragino LSE01) installed and a gateway (dragino DLOS8 8 channels ) in the area too (a farm far from the city).
The payload I use is 11 bytes and I send data every 20 min.
The maximum distance between a sensor and the gateway is 1 KM, without buildings or hills, only trees in the farm.
I was in the console for a while checking the status and I see that all the sensors transmit every 20 min as I configured them. the frame counter is incremented correctly and until then everything is fine.
I am using a HTTP integration with my DB.
The problem is that I dont receive the all data in my database, I only receive the information from some sensors, I think randomly. If I look at the console in the data section, no new data appears, the display is always empty, but when looking at the device the counter increased and my “last seen” is always every 20 minutes for each end-node as it should be.
i readed a few other topics regarding dragino but not with this spesific problem, i dont know if this is a problem with limits on the TTN account, or is a problem with dragino gateway or something else
What could be happening ?, Is there a limit of messages in TTN? (I am sending 1152 daily messages in total).
Why am I getting data from only some devices?
Before doing this installation, I did some tests in my lab with 2 identical devices transmitting data every 20 minutes, I had them running for a couple of weeks without problems.
Please don’t use confirmed uplink, it doesn’t work very well, and will burn through your downlink allowance in no time.
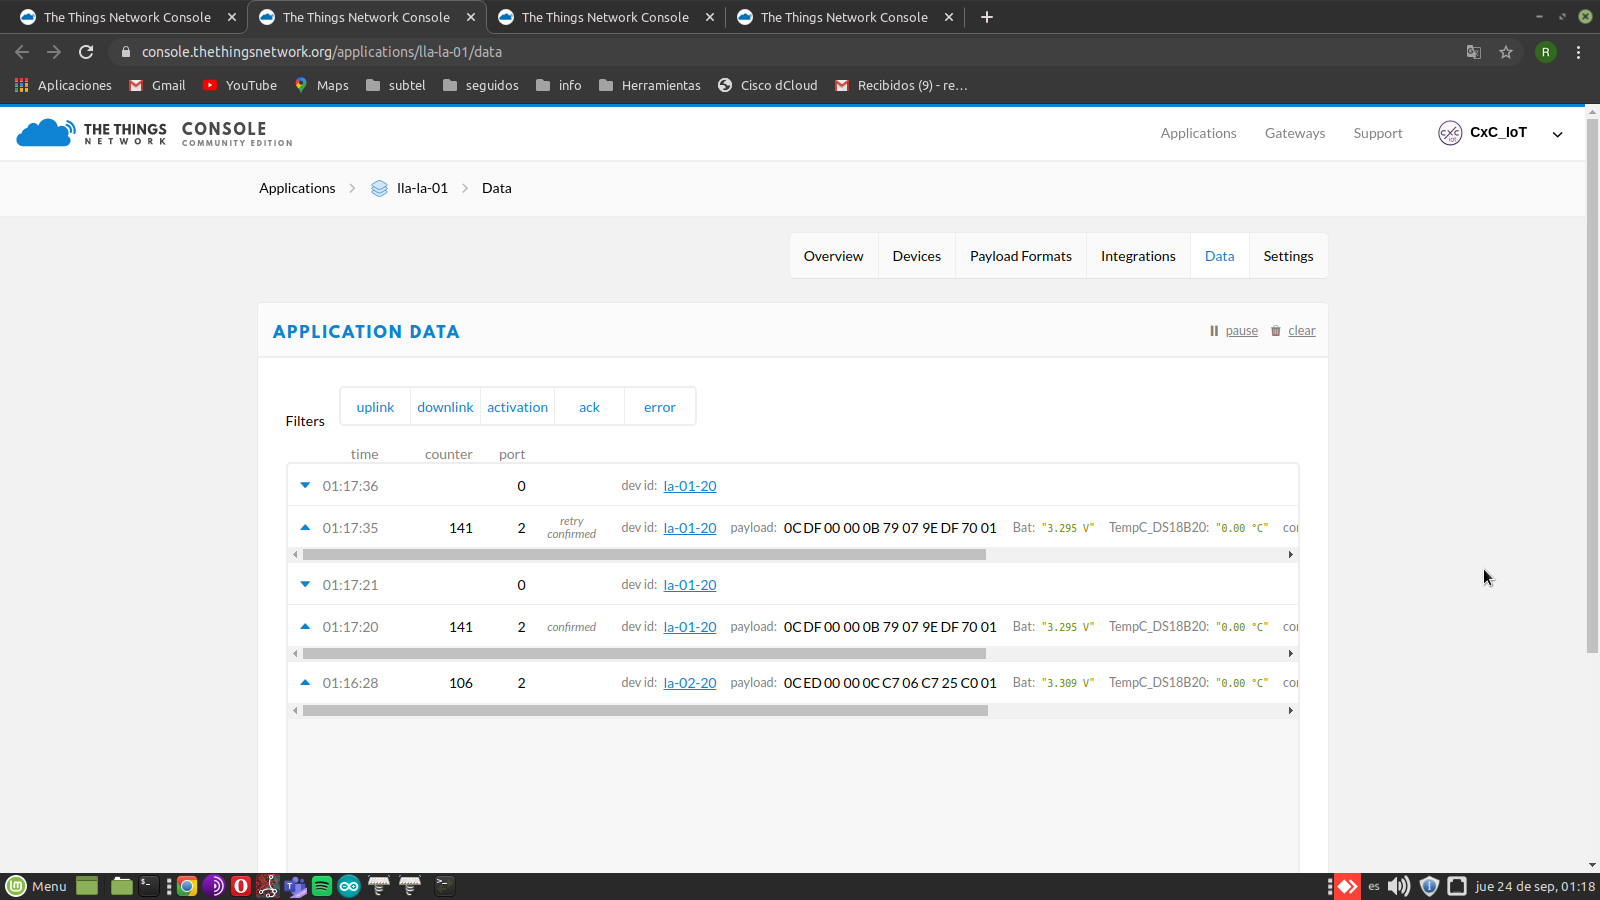
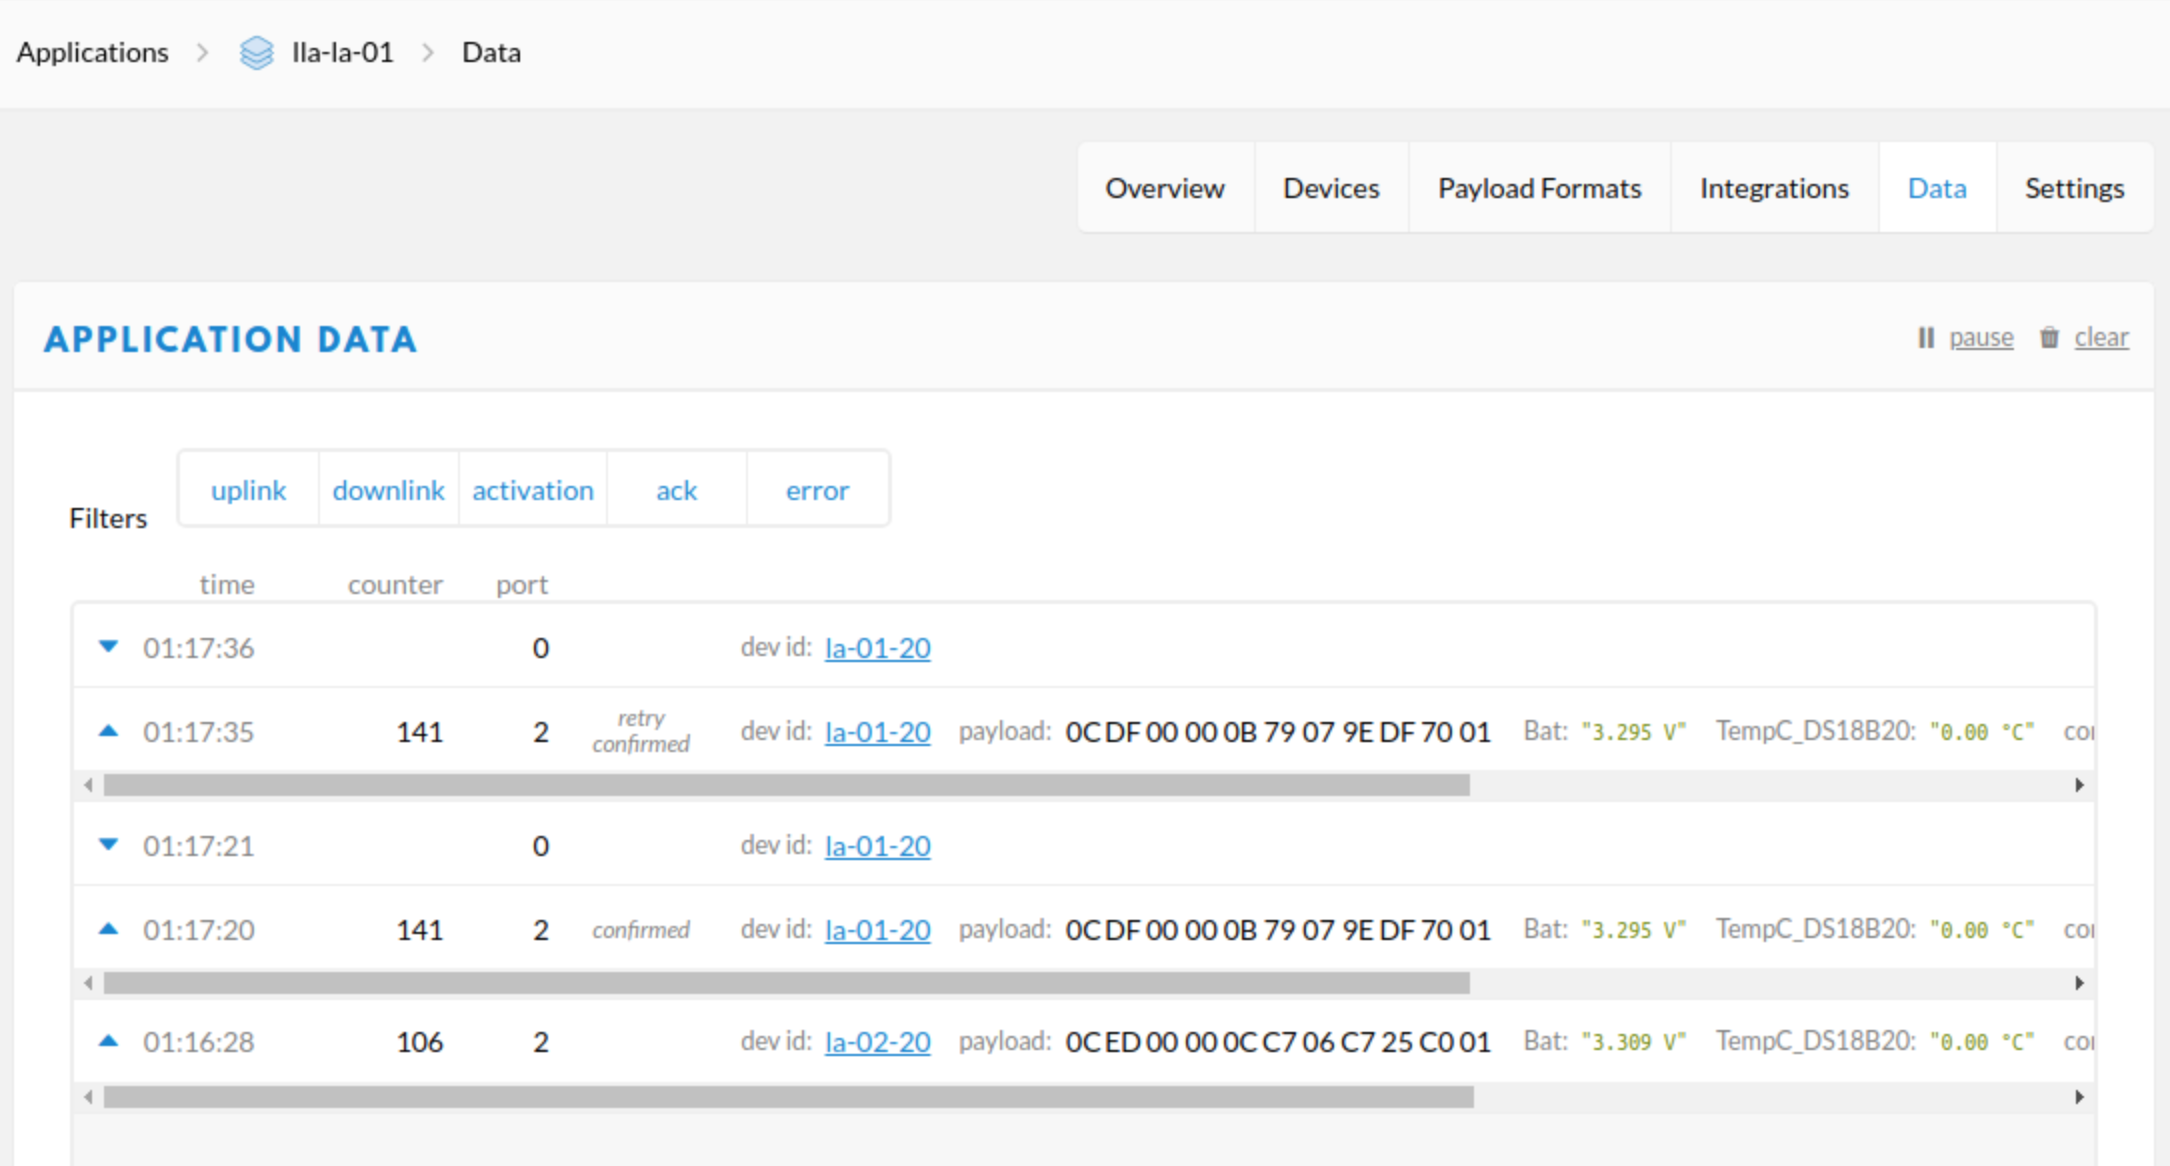
The message marked “retry confirmed” has the same frame counter value as the previous one, so it’s going to be dropped and not passed on.
That looks like an example of what is wrong with the confirmed uplink idea; if a message is confirmed once, and the node misses hearing the confirmation, none of the retries should get another confirmation for that frame count value. Why there appears to be a downlink after the retry is a bit of a mystery… I wouldn’t think a repeat packet would even be eligible to attach MAC commands to.
You also seem to have something very strange going on where there’s a huge jump in the sequence number from 106 to 141 in just a minute…
But anyway, please stop using confirmed uplink.
Beyond that, see if you can get a log of a series of raw packets from the gateway page with at least the first bytes of the payload visible, and post that - the data will be still encrypted, but the headers will be a clue as to what is really going on.
I understand your point with the confirmed uplink. i just using this project as a lab. in fact i dont have problems with the data that you can see (except what you mention to me about the confirmed uplink). The problem is with the data that I don’t see in my DB or in the TTN console.
Maybe the pictures not helped.
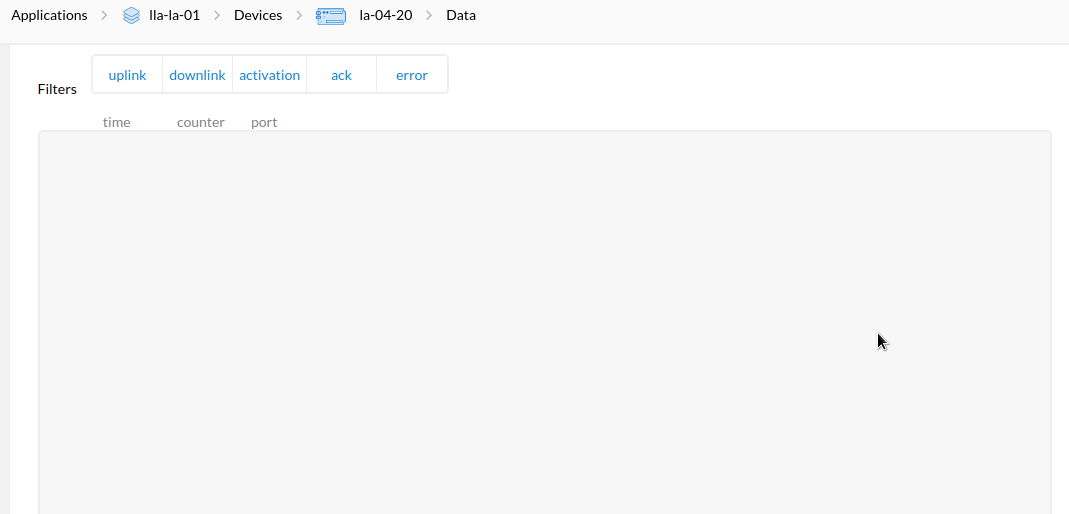
This picture show the all data on my application and if you check, there are 2 devices showing: la-01-20 and la-02-20 that is the reason for the difference bwteen counters.
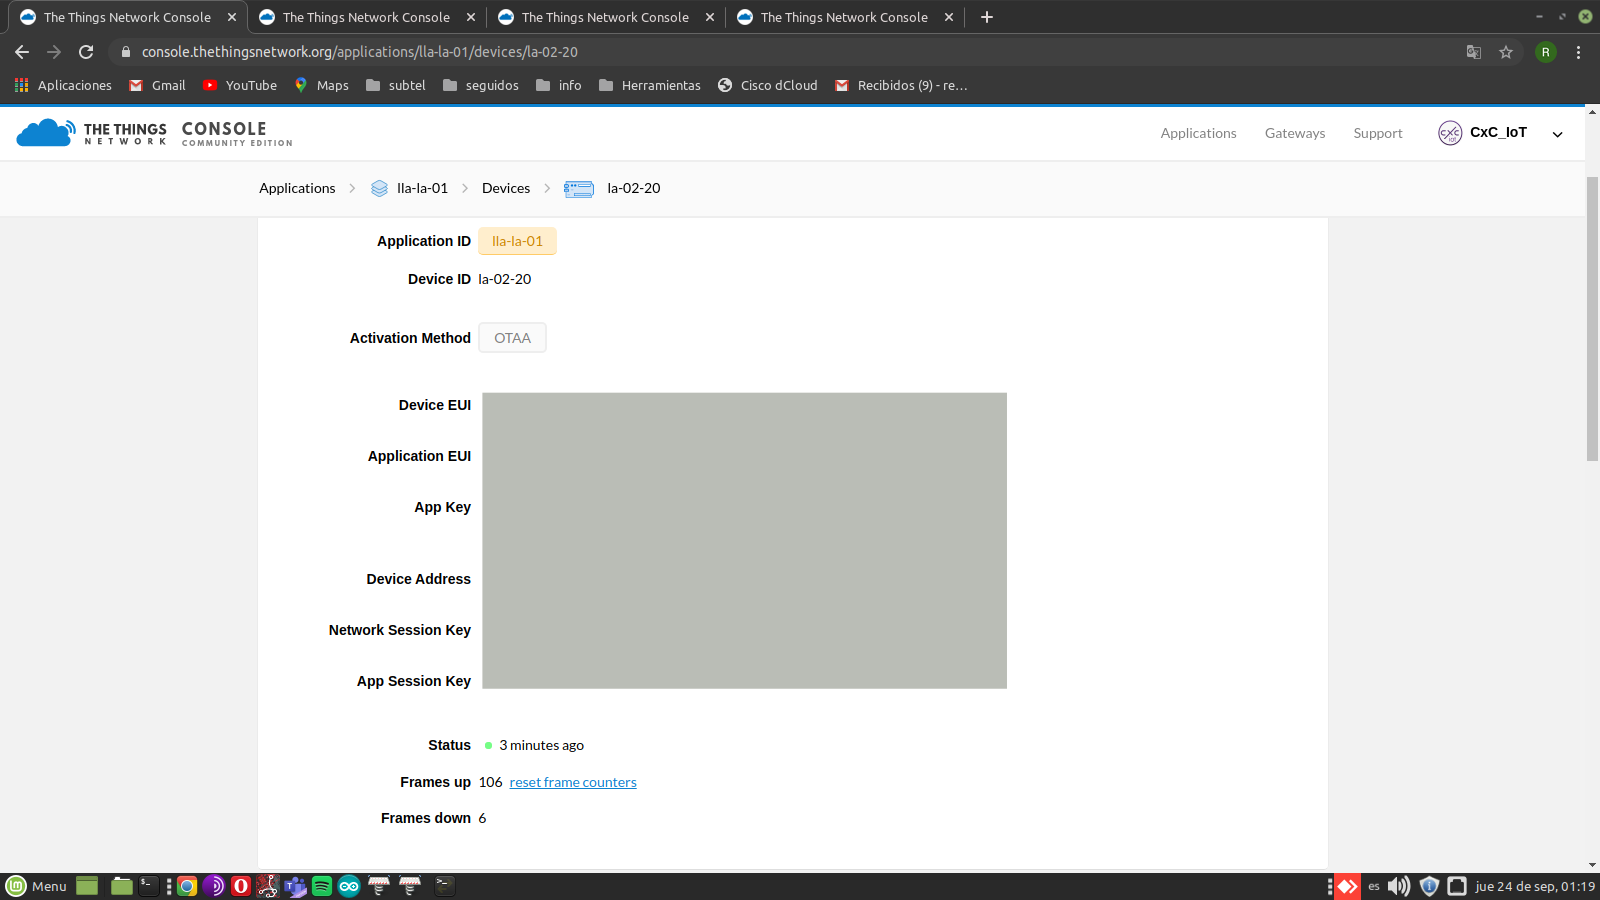
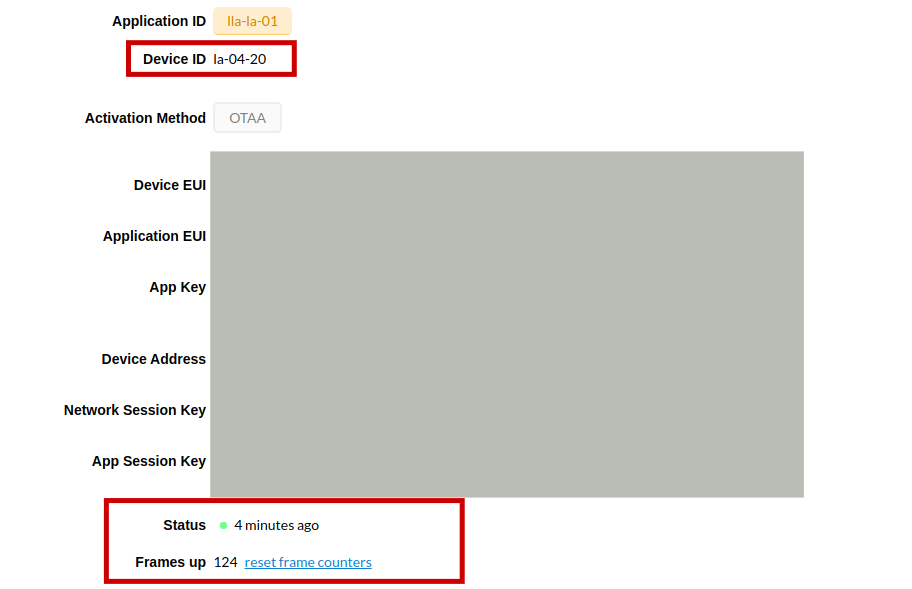
the point i want to show is other: for example for this device i get a status 4 minutes ago but i dont have any data in my DB and i cant see any data in device data section
Unfortunately, not seeing anything in TTN Console does not always imply it was not processed.
But, you’re also saying that the HTTP Integration is not getting all messages while the “Status” and “Frames up” are being updated. Right?
Are you sure your HTTP endpoint is not being triggered? Any chance your Decoder is failing for some payloads? (The HTTP Integration should then still be invoked, I think.) Or that you defined a Converter that is somehow faulty? (Again, I think the HTTP Integration should be invoked regardless.)
To be sure you’re seeing all errors, I’d subscribe to the #/devices/#/events/# topic of the MQTT Data API.
Unfortunately, not seeing anything in TTN Console does not always imply it was not processed.
in this case i can confirm that when i dont see data in TTN console, doesnt arrive to the endpoint neither
But, you’re also saying that the HTTP Integration is not getting all messages while the “Status” and “Frames up” are being updated. Right?
that’s right
Are you sure your HTTP endpoint is not being triggered? Any chance your Decoder is failing for some payloads? (The HTTP Integration should then still be invoked, I think .) Or that you defined a Converter that is somehow faulty? (Again, I think the HTTP Integration should be invoked regardless.)
I removed the encoder but the problem is still
Maybe if I use DB integration instead of HTTP i can descart that the issue come from the my DB.
I assume you meant Decoder? (An Encoder is used for downlinks.)
If you’re in doubt if your HTTP handler may be triggered but not handling the uplink right, then you could also test with, e.g., https://requestbin.com/
I assume you meant Decoder? (An Encoder is used for downlinks.)
ahaha Yes, i always confuse this terms…
And be sure to subscribe using MQTT!
My problem with MQTT is that I am not the owner of the database, I am just doing the integration and the owner uses a very old system to manage the data so I am struggling with that too, maybe the solution is to make a bridge: MQTT → bridge → HTTP.
So a limit or restriction is completely ruled out for being sent many messages, right?
As the HTTP integration is partially working for you, you’d only need MQTT for debugging, to see if there are any error events that help figuring out what’s happening. In fact, I’d subscribe to the wildcard #, to see everything, including the uplinks. You can use MQTT and the HTTP Integration simultaneously.
Indeed, there are no limits being enforced.
Just to be sure: are you seeing messages in the gateway’s Traffic page that you’re not seeing in the HTTP integration? Or is all based on the “Status” and “Frames up”?
everything is based on “status” and “frames”, because the hardware is installed on a farm far from my office (in another city).
This is perhaps an important detail that I forget to mention:
At the time of installation, I could verify that the first data from each sensor/end-node reached the gateway and even TTN and my DB. After that I started to have problems but I was already far from the place.
Understanding what is going on would start with examining the raw traffic from the gateway.
If there are packets from node addresses, the sequence numbers will be seen. If those sequence numbers are not incrementing, the packets should be being silently ignored.
If there are no packets from current node addresses, that explains some of the issue.
And if there are packets that only contain MAC commands, that also does.
Or packets that are join requests not application traffic; or join requests invalidly re-using join nonces…
To understand what is going on, you need to look at raw packet level.
Note that a gateway owner could add you as a “collaborator”, so you could see the gateway’s Traffic page in TTN Console. (That is: if that part is working; it’s a known issue that TTN Console may show nothing while things are actually being received and handled. But at least if you see traffic then you can investigate more.)
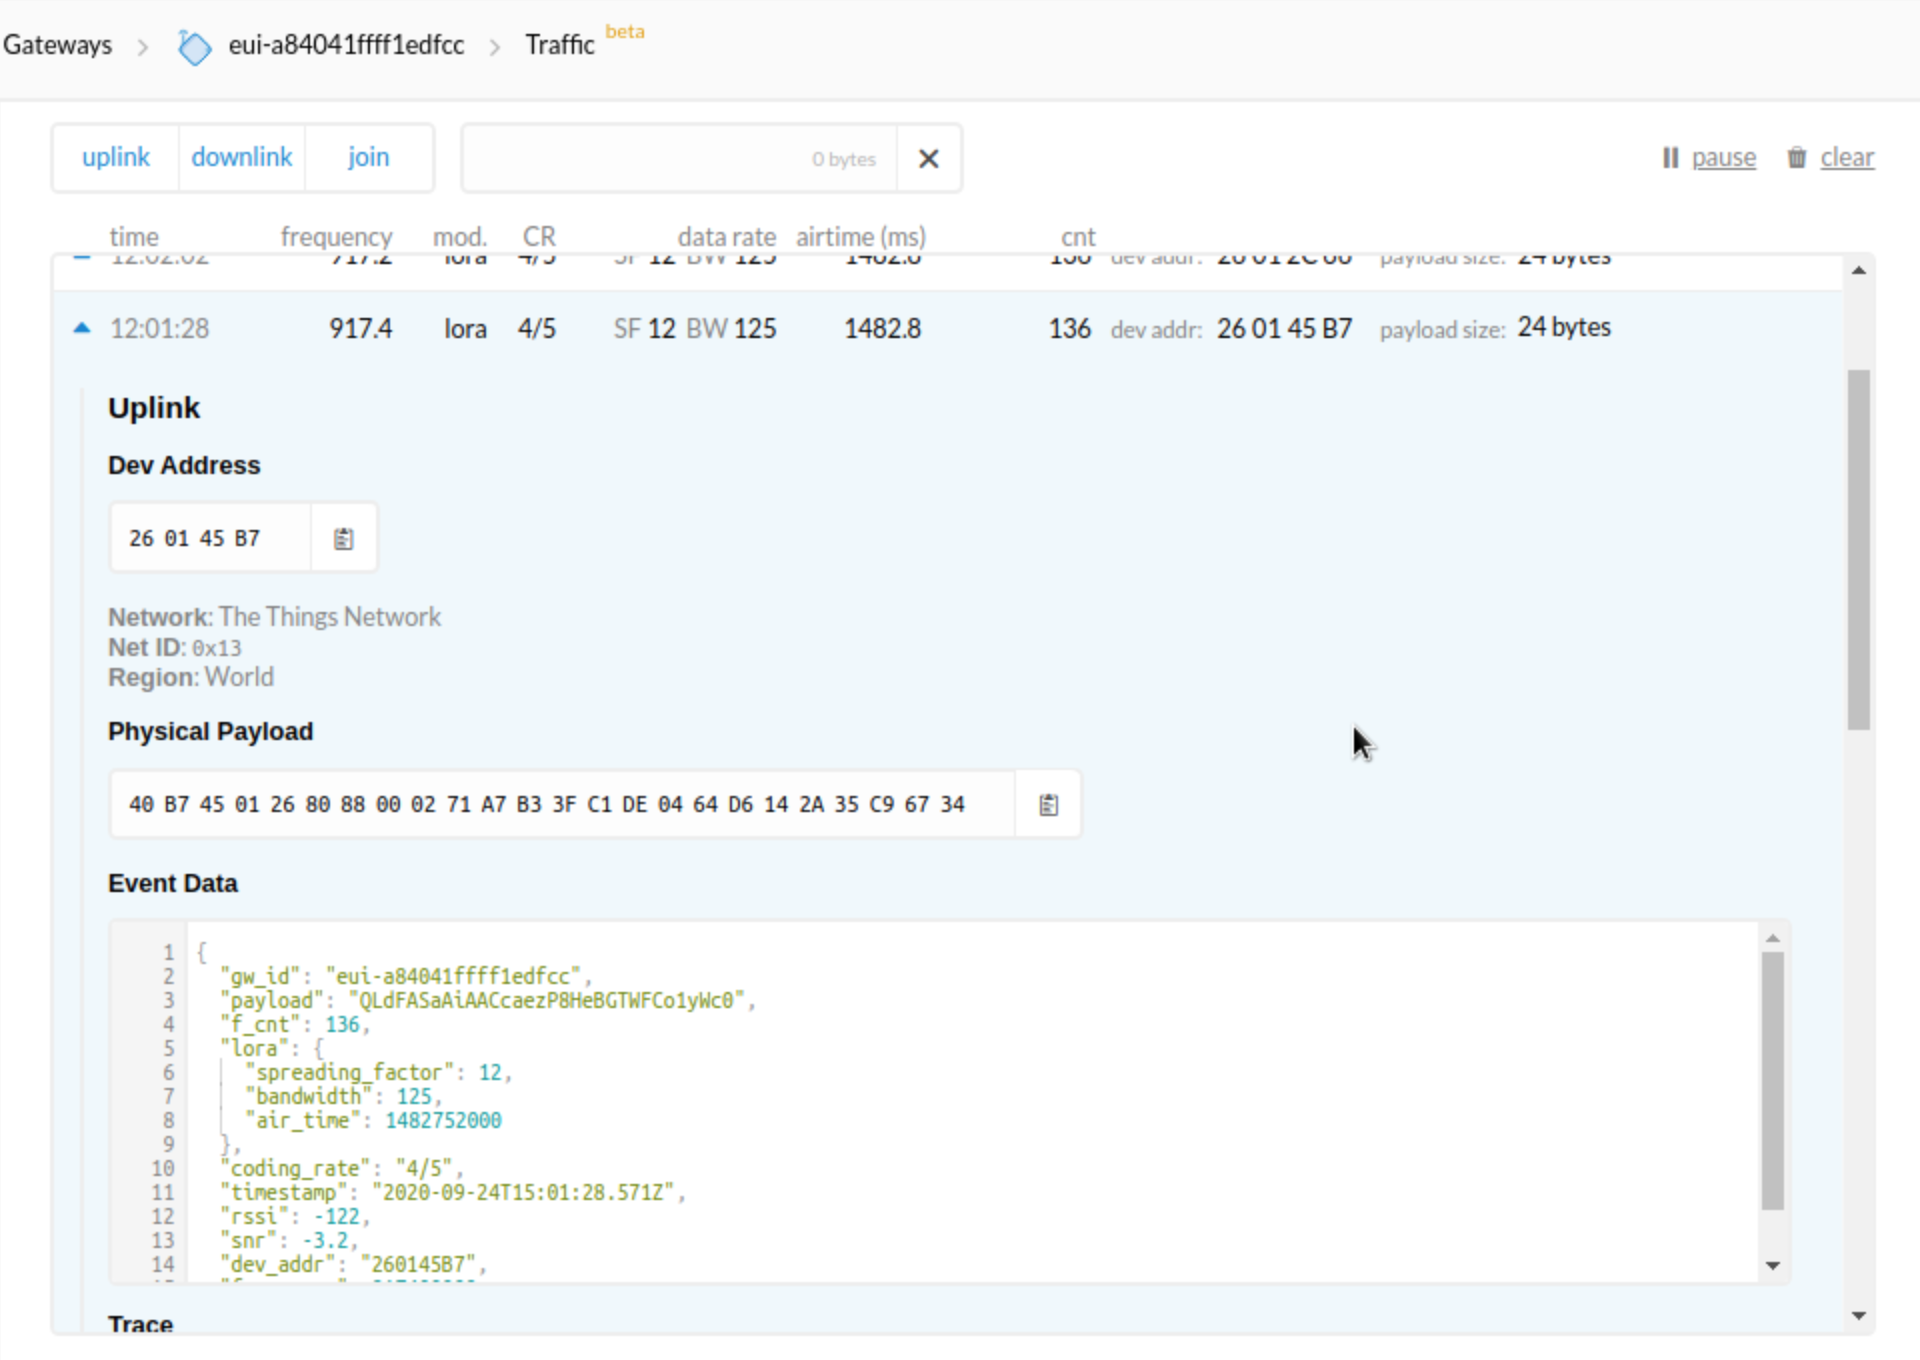
Aside: no funny unsupported MAC commands in that uplink; FCtrl = 0x80 only has its ADR bit set, and FOpts is empty. Looks good. If you want to see the decrypted application payload then you could paste the current OTAA NwkSKey and AppSKey session keys into the online decoder. But even an unexpected payload should not stop handling within TTN.
It may smell that despite ADR and apparently at most 1 km distance, the device is still at SF12 for its 136th uplink. I don’t know how to read an RSSI of -122 and an SNR of -3.2. But SF12 and the reception quality should really be unrelated to further handling, I think. Apart from providing more uplinks, please also make sure that the Trace part that’s not in the screenshot has no weird messages.
Are you seeing SF12 for all your data, even if it’s handled correctly?
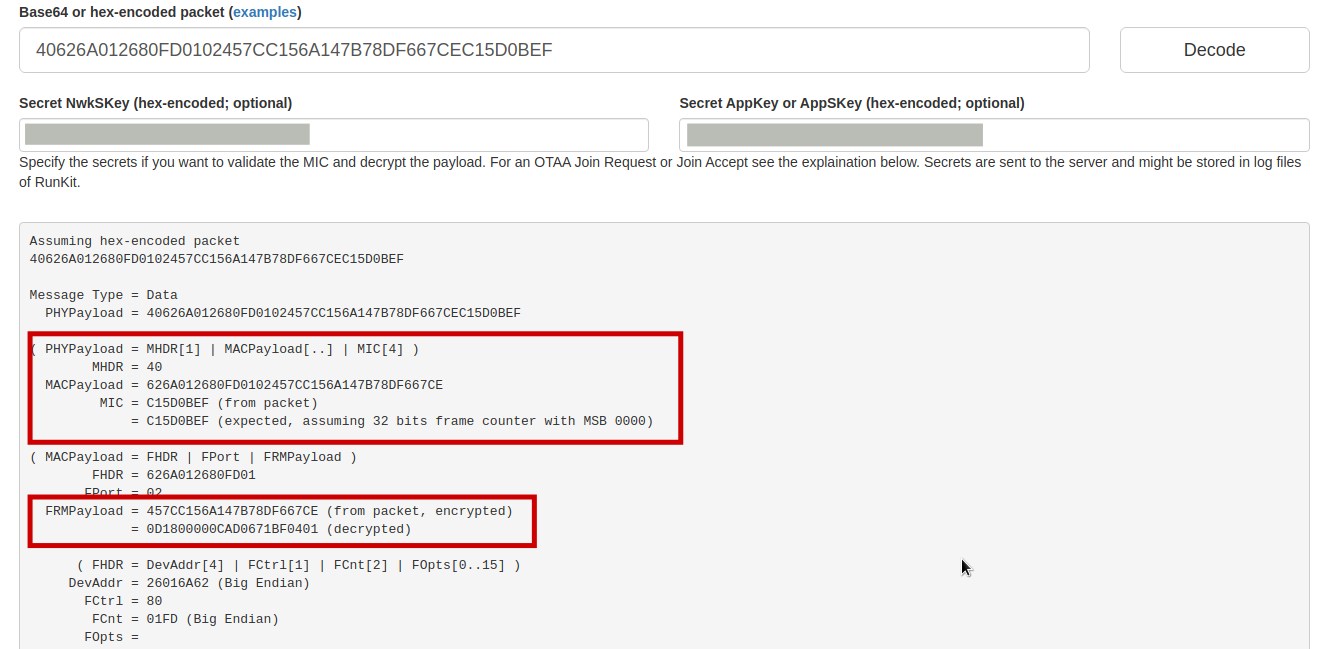
You may want to paste the secrets into the online decoder anyway, to ensure the MIC is okay; maybe the gateway is forwarding packets that have an invalid CRC?
Thanks @cslorabox and @arjanvanb for your comments and feedback.
I do a complete analysis of the data and I think I’m better understanding the picture.
First of all i am based on Chile, LATAM, here we use the AU915 Frecuency Plan. (Latam is messy and different countries use different regulations so AU915 fits in most countries)
I have distributed the 16 sensor in 4 points (4 sensors per point), and I’m getting data only from point 1 and point 2, even more so, points 3 and 4 are the furthest. this is already giving me some clue.
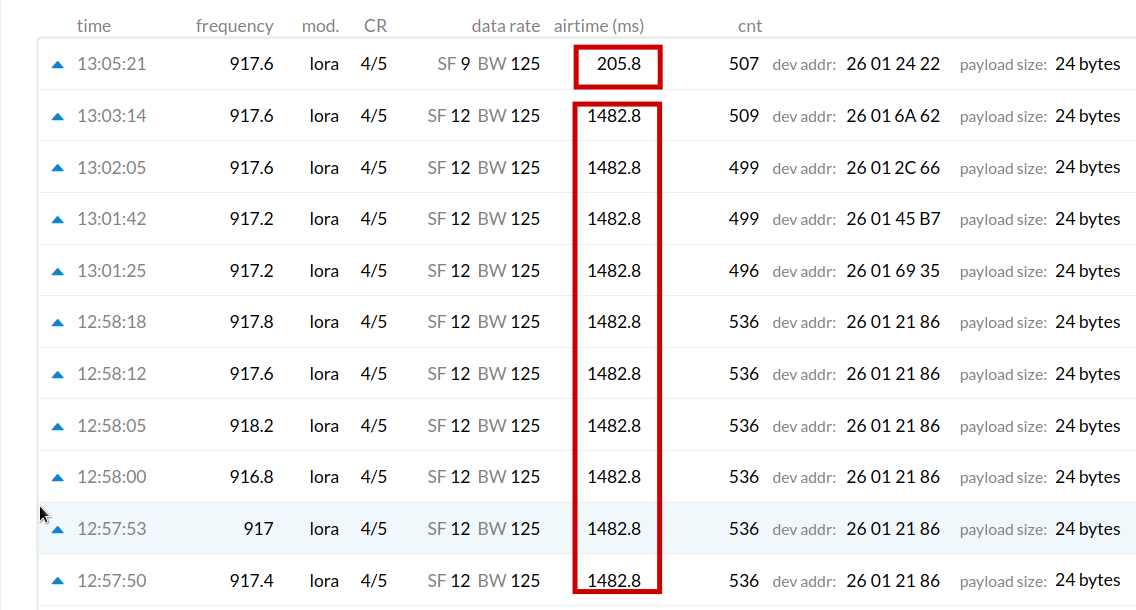
In this image i can see that there are messages with SF9 and messages with SF12 (all masagges has the same payload size). I review each packet and noticed that all packets with SF12 takes 1482.8 ms and that exceeds the allowed limit for AU915 according to this tool: [https://avbentem.github.io/airtime-calculator/ttn/au915/11] all those packets are the ones I don’t get in my DB(and i dont see in the TTN console either)
So my question now is: How can I make the devices transmit at a SF that does not exceed the limits? do i need to improving the antennas and the points where the devices are located? another idea?
It seems you missed the part in bold in my previous post. You’ve got a mismatch in the configuration of the gateway, which is configured for US915 while your node is using AU915. Or, if it’s not your gateway, then using AU915 in an area where others use US915 is getting you into trouble?
There’s a lot of information to read below the results. TTN is not filtering anything, but TTN also does not know SF11 and SF12 for US915. So, the problem is in the gateway’s configuration. (Still then, using a better data rate, if possible, is always a good idea.)