Dragino sensor + dragino lgateway loosing messages in a weird way

As the HTTP integration is partially working for you, you’d only need MQTT for debugging, to see if there are any error events that help figuring out what’s happening. In fact, I’d subscribe to the wildcard #, to see everything, including the uplinks. You can use MQTT and the HTTP Integration simultaneously.

Indeed, there are no limits being enforced.

Just to be sure: are you seeing messages in the gateway’s Traffic page that you’re not seeing in the HTTP integration? Or is all based on the “Status” and “Frames up”?

everything is based on “status” and “frames”, because the hardware is installed on a farm far from my office (in another city).
This is perhaps an important detail that I forget to mention:
At the time of installation, I could verify that the first data from each sensor/end-node reached the gateway and even TTN and my DB. After that I started to have problems but I was already far from the place.

Understanding what is going on would start with examining the raw traffic from the gateway.

If there are packets from node addresses, the sequence numbers will be seen. If those sequence numbers are not incrementing, the packets should be being silently ignored.

If there are no packets from current node addresses, that explains some of the issue.

And if there are packets that only contain MAC commands, that also does.

Or packets that are join requests not application traffic; or join requests invalidly re-using join nonces…

To understand what is going on, you need to look at raw packet level.

Note that a gateway owner could add you as a “collaborator”, so you could see the gateway’s Traffic page in TTN Console. (That is: if that part is working; it’s a known issue that TTN Console may show nothing while things are actually being received and handled. But at least if you see traffic then you can investigate more.)

i have info for a message that was sent and i dont see it in TTN console or my DB:

Gateway Traffic

This is the physical Payload:
40B74501268088000271A7B33FC1DE0464D6142A35C96734

Please show preceding and following raw messages from this node, too

And in MQTT…?

Aside: no funny unsupported MAC commands in that uplink; FCtrl = 0x80 only has its ADR bit set, and FOpts is empty. Looks good. If you want to see the decrypted application payload then you could paste the current OTAA NwkSKey and AppSKey session keys into the online decoder. But even an unexpected payload should not stop handling within TTN.

It may smell that despite ADR and apparently at most 1 km distance, the device is still at SF12 for its 136th uplink. I don’t know how to read an RSSI of -122 and an SNR of -3.2. But SF12 and the reception quality should really be unrelated to further handling, I think. Apart from providing more uplinks, please also make sure that the Trace part that’s not in the screenshot has no weird messages.

Some more:

Am I right to assume that 917.4 MHz refers to AU915? (US915 does not support SF11 and SF12.) Are you using Meshed?

Are you seeing SF12 for all your data, even if it’s handled correctly?

You may want to paste the secrets into the online decoder anyway, to ensure the MIC is okay; maybe the gateway is forwarding packets that have an invalid CRC?

Ehhh, https://www.thethingsnetwork.org/gateway-data/gateway/eui-a84041ffff1edfcc refers to US915…?

Given the terrible signal strength I wouldn’t expect ADR to ramp it up much.

But if the range is really that short, that low signal strength points to obstructions, antenna issues, etc…

It does mean the probability of corruption is real enough that checking the MIC as you suggested is warranted.

Hello, I am back with news.

Thanks @cslorabox and @arjanvanb for your comments and feedback.
I do a complete analysis of the data and I think I’m better understanding the picture.

First of all i am based on Chile, LATAM, here we use the AU915 Frecuency Plan. (Latam is messy and different countries use different regulations so AU915 fits in most countries)
I have distributed the 16 sensor in 4 points (4 sensors per point), and I’m getting data only from point 1 and point 2, even more so, points 3 and 4 are the furthest. this is already giving me some clue.

In this image i can see that there are messages with SF9 and messages with SF12 (all masagges has the same payload size). I review each packet and noticed that all packets with SF12 takes 1482.8 ms and that exceeds the allowed limit for AU915 according to this tool: [https://avbentem.github.io/airtime-calculator/ttn/au915/11] all those packets are the ones I don’t get in my DB(and i dont see in the TTN console either)

image

So my question now is: How can I make the devices transmit at a SF that does not exceed the limits? do i need to improving the antennas and the points where the devices are located? another idea?

(I can understand the hole thing reading this post: Limitations: data rate, packet size, 30 seconds uplink and 10 messages downlink per day Fair Access Policy [guidelines])

By the way: the MIC its ok with all packets that i dont recieve:

It seems you missed the part in bold in my previous post. You’ve got a mismatch in the configuration of the gateway, which is configured for US915 while your node is using AU915. Or, if it’s not your gateway, then using AU915 in an area where others use US915 is getting you into trouble?

{
  "eui-a84041ffff1edfcc": {
    "id": "eui-a84041ffff1edfcc",
    "description": "Gateway en caseta riego",
    "owner": "greensuperfood",
    "owners": [
      "greensuperfood"
    ],
    "attributes": {
      "brand": "Dragino",
      "frequency_plan": "US_902_928",
      "placement": "indoor"
    },
    "last_seen": "2020-09-29T16:05:21Z"
  }
}

For Chili, TTN uses AU915 indeed, so that gateway is wrong.

There’s a lot of information to read below the results. TTN is not filtering anything, but TTN also does not know SF11 and SF12 for US915. So, the problem is in the gateway’s configuration. (Still then, using a better data rate, if possible, is always a good idea.)

I really don’t know why that appears.
I bought and configured all the network devices on the au915 band myself

What does the Overview page for the gateway show?

And for future readers, before you change anything: is there really no clue in the “Trace” part of those uplinks?

image

Actually I’d argue would be the other way around.

A typical US gateway configuration will quite happily receive messages at SF11 and SF12, I’m not even sure there’s any way to tell the baseband chip not to. In fact I have a system that occasional puts out very short non-LoRaWAN test message at SF12 (even LoRaWAN headers don’t fit, it’s more a partial device address without checksum) and they are picked up just fine.

But these are non-existent data rates in the US915 regional parameters, so quite possibly getting dropped by TTN servers if they are asked to make sense of the packets in the context of a supposedly US915 system.

If your device firmware properly implements the regional paramaters of the region your device is registered with TTN in, then the firmware should not be going to illegal SF’s to begin with. A mismatch or mis-implementation of settings may be at issue.

If SF11 and SF12 are allowed, but you decide strategically not to use them, then either you use an existing capability of the device’s firmware to tell it that there is a maximum SF it is allowed to use, or you modify the device’s firmware to implement such a limit if it did not before.

Note that even if using SF10 you probably want to keep your data packet very compact to keep the airtime short. Make sure you aren’t trying to send too much, or using an inefficient data format or packing scheme.

For point of reference:

in AU915 DR0 is SF12 125 KHz

in US915 DR0 is SF10 125 KHz and the airtime limit of 400 ms means that after adding the LoRaWAN headers only fairly short packets are allowed

Exactly that, I think. Peeking into the code (and the Trace part when clicking an uplink) one will see that when receiving an uplink, TTN is already preparing the empty downlinks before delegating the uplink to the broker. The network server may set some confirmation part, and maybe some MAC commands, like for ADR, if applicable. I think that the broker (or whatever is handling the uplink) can then set an application payload and port to those downlinks, if needed. If the downlinks are not used, they’ll be discarded.

I assume that TTN fails to determine the downlink channels when receiving SF11 or SF12 for US915, so will fail to prepare the possible downlinks, and hence will indeed drop the uplink. (Maybe not explicitly, but just running into an error; that’s why I wonder if the Trace parts of the uplinks show anything funny.)

@CxC_IoT, as for why TTN Console shows AU915 above while gateway-data/gateway/eui-a84041ffff1edfcc shows US915, I don’t know. Maybe it was configured wrongly at some point, and changes failed to propagate to all components? Maybe the ttn-router-us-west expects US915? (I hope not, but we’ve seen weird defaults for downlink channels too.)

More fun, ttnctl gateways info shows AU915:

ttnctl gateways info eui-a84041ffff1edfcc
  INFO Found gateway                           

          Gateway ID: eui-a84041ffff1edfcc
      Frequency Plan: AU_915_928
              Router: ttn-router-us-west
         Auto Update: off
               Owner: greensuperfood
        Owner Public: yes
     Location Public: yes
       Status Public: yes

           Placement: indoor
         Description: Gateway en caseta riego

…and ttnctl gateways status fails:

ttnctl gateways status eui-a84041ffff1edfcc
  INFO Discovering Router...                   
  INFO Connecting with Router...               
  INFO Connected to Router                     
 FATAL Could not get status of gateway.
       GatewayID=eui-a84041ffff1edfcc
       error=Gateway eui-a84041ffff1edfcc not found

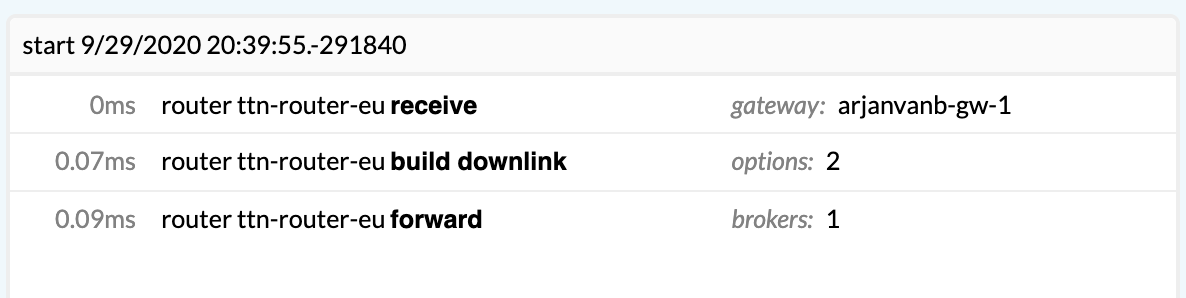
Please show that Trace part?

If you’re referring to my “the problem is in the gateway’s configuration” then please note I don’t know if that would be in the gateway hardware, or in the TTN settings. But something is off.

Hi! I have the same Gateway and also implement a LoRa network in a field with Dragino sensors, in Chile.
I had the exact same problem. You can deactivate the ADR mode of the sensors to prevent them from acquiring an SF greater than 10 and also adjust the DR for a suitable SF. All by AT commands, you will need a USB-TTL converter + cable to program the sensor.

My network works fine after making those settings. But for a few days I have problems, the data does not reach my application. I suspect the configuration of the Gateway
Did you configure your Gateway with au915.thethings.meshed.com.au?Hi! I have the same Gateway and also implement a LoRa network in a field with Dragino sensors, in Chile.
I had the exact same problem. You can deactivate the ADR mode of the sensors to prevent them from acquiring an SF greater than 10 and also adjust the DR for a suitable SF. All by AT commands, you will need a USB-TTL converter + cable to program the sensor.

My network works fine after making those settings. But for a few days I have problems, the data does not reach my application. I suspect the configuration of the Gateway

Did you configure your Gateway with au915.thethings.meshed.com.au?

Hi Atorres.
Many time without review this forum…
You are rigth! I did the same tasks that you and works.
I deactivated the ADR and set an appropriate one.
i hope this information works for anyone else. Best regards