Google Cloud GCP using custom webhook stopped

Hello,

I send data to to TTN and see data there, but I cannot see data on my Firestore database on GCP. I used a custom webhook to send a post request to an endpoint on GCP and it was working, until a week ago, but it doesn’t transfer data anymore. I don’t even see if the service is called. No log regarding the service is called.

I wonder if there is a way to decode in the TTN dashboard to see if it calls the endpoint or something else is wrong.

I see that on top of the page it says: “Fair use policy applies” and sometime “No support plan”. Can this be the reason?

Thank you.

The device or application console log shows if it is sending and if there was an error - you may have to turn on verbose mode.

Hard to say, how often are you sending uplinks?

As for support, on TTN the forum is support.

For readability & indexing I’ve removed the redundancies from the title.

Thank you for the response. I’m developing something and need to send data every 20 seconds or so, for example.
I created another webhook last night but it is in the pending status yet. I don’t see any error or log related to sending data over the webhook. One webhook in an app will be connected to all devices in that app, right?

I also got my own indoor gateway as I don’t have coverage in my area.

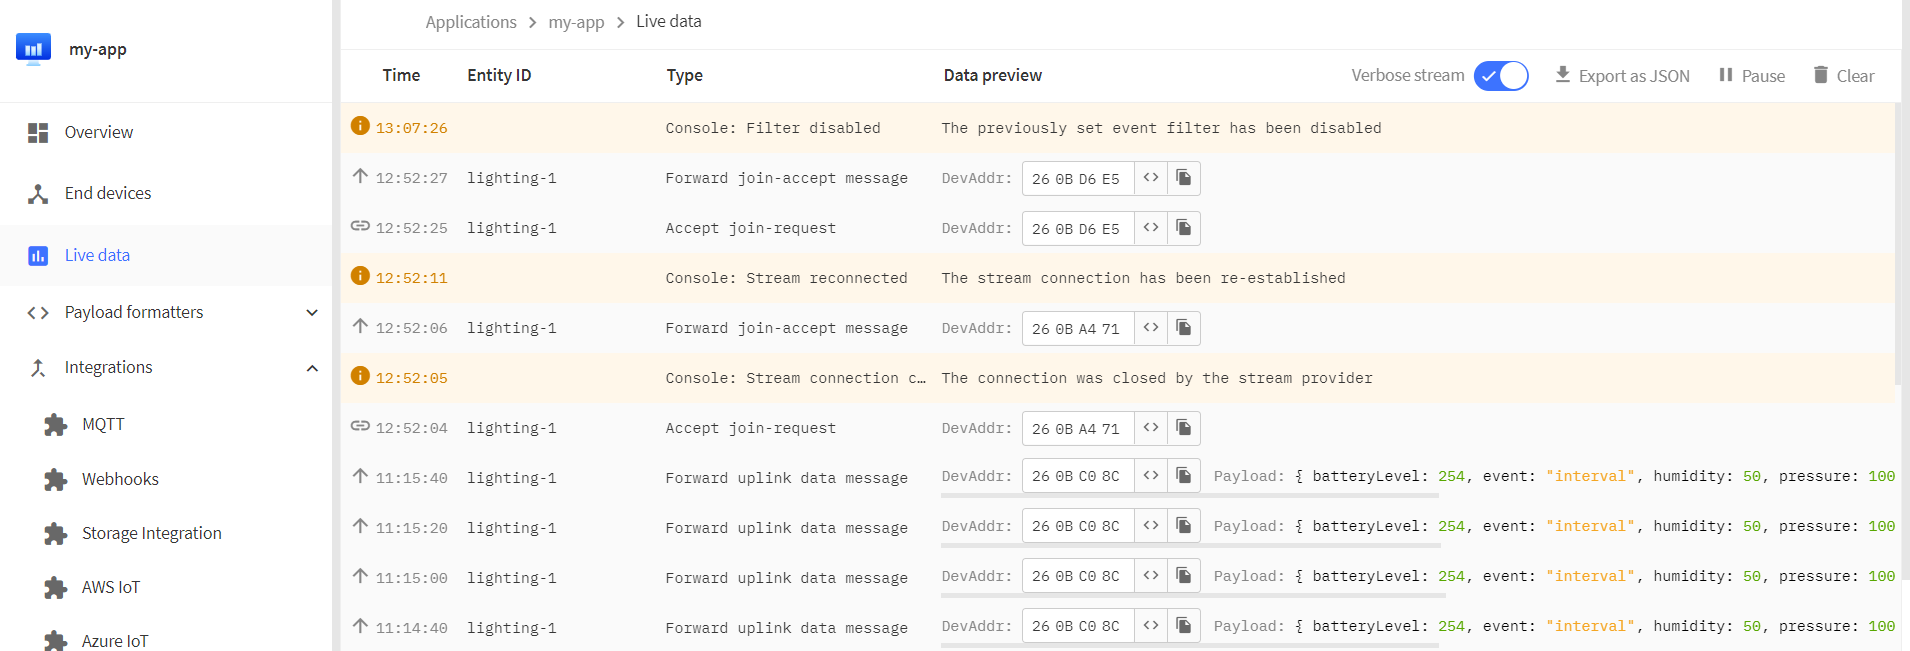
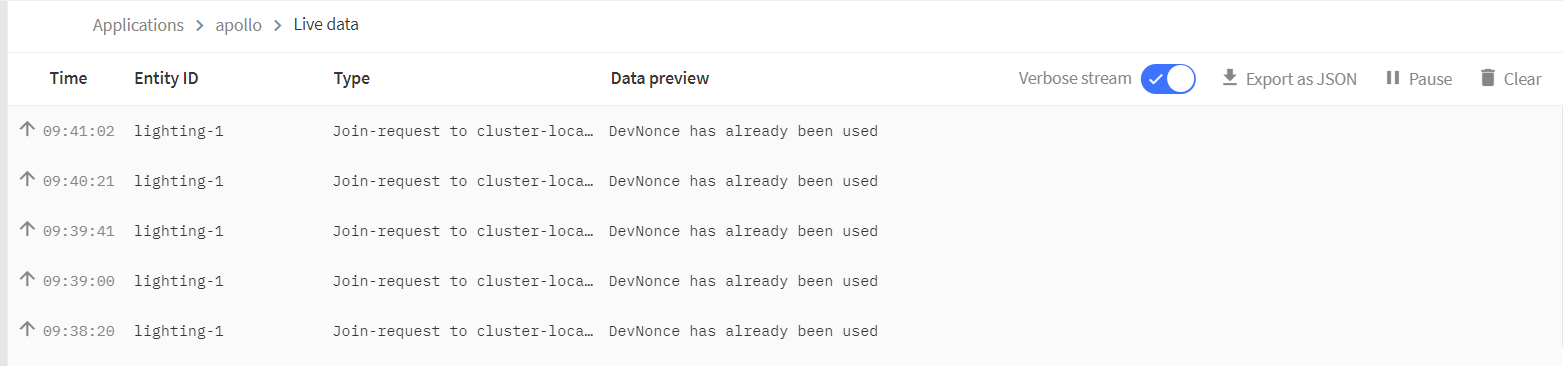
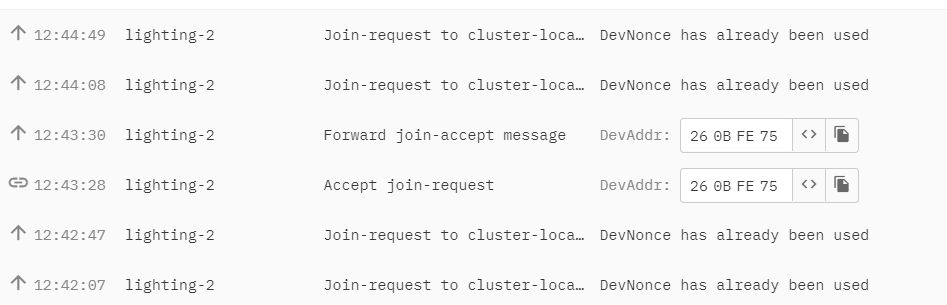
Here is what I see on the dashboard:

{
  "name": "as.up.data.forward",
  "time": "2022-08-03T09:12:00.199660745Z",
  "identifiers": [
    {
      "device_ids": {
        "device_id": "lighting-1",
        "application_ids": {
          "application_id": "lighting"
        },
        "dev_eui": "2CF7F1203230F77A",
        "join_eui": "8000000000000006",
        "dev_addr": "260BC08C"
      }
    }
  ],
  "data": {
    "@type": "type.googleapis.com/ttn.lorawan.v3.ApplicationUp",
    "end_device_ids": {
      "device_id": "lighting-1",
      "application_ids": {
        "application_id": "lighting"
      },
      "dev_eui": "2CF7F1203230F77A",
      "join_eui": "8000000000000006",
      "dev_addr": "260BC08C"
    },
    "correlation_ids": [
      "as:up:01G9HFKRY3PWCEPQ1SGW6H9J7F",
      "gs:conn:01G9H3VMEDS5NDGPT7AQQF1ERN",
      "gs:up:host:01G9H3VMEMBHAFBBZA9S3QWH5G",
      "gs:uplink:01G9HFKRQMTKZ38C62C616TEV6",
      "ns:uplink:01G9HFKRQMTHYKPEGRVMWAE5VB",
      "rpc:/ttn.lorawan.v3.GsNs/HandleUplink:01G9HFKRQMEBNFMENTVJ66E2TK",
      "rpc:/ttn.lorawan.v3.NsAs/HandleUplink:01G9HFKRY2MZJ1V8CGPCZD1MPW"
    ],
    "received_at": "2022-08-03T09:12:00.195340755Z",
    "uplink_message": {
      "session_key_id": "AYJi+P3wwDxMxtgCZ2WrvA==",
      "f_port": 2,
      "f_cnt": 3,
      "frm_payload": "JxAOAfT+",
      "decoded_payload": {
        "batteryLevel": 254,
        "event": "interval",
        "humidity": 50,
        "pressure": 1000,
        "temperature": 14
      },
      "rx_metadata": [
        {
          "gateway_ids": {
            "gateway_id": "isaac-indoor-gateway",
            "eui": "58A0CBFFFE8044D5"
          },
          "time": "2022-08-03T09:11:59.931359052Z",
          "timestamp": 3734029916,
          "rssi": -54,
          "channel_rssi": -54,
          "snr": 11,
          "uplink_token": "CiIKIAoUaXNhYWMtaW5kb29yLWdhdGV3YXkSCFigy//+gETVENyMw/QNGgwI3/eolwYQnNub1wMg4K6brNbmAioMCN/3qJcGEMzSjbwD"
        }
      ],
      "settings": {
        "data_rate": {
          "lora": {
            "bandwidth": 125000,
            "spreading_factor": 8
          }
        },
        "coding_rate": "4/5",
        "frequency": "868300000",
        "timestamp": 3734029916,
        "time": "2022-08-03T09:11:59.931359052Z"
      },
      "received_at": "2022-08-03T09:11:59.988836357Z",
      "consumed_airtime": "0.102912s",
      "network_ids": {
        "net_id": "000013",
        "tenant_id": "ttn",
        "cluster_id": "eu1",
        "cluster_address": "eu1.cloud.thethings.network"
      }
    }
  },
  "correlation_ids": [
    "as:up:01G9HFKRY3PWCEPQ1SGW6H9J7F",
    "gs:conn:01G9H3VMEDS5NDGPT7AQQF1ERN",
    "gs:up:host:01G9H3VMEMBHAFBBZA9S3QWH5G",
    "gs:uplink:01G9HFKRQMTKZ38C62C616TEV6",
    "ns:uplink:01G9HFKRQMTHYKPEGRVMWAE5VB",
    "rpc:/ttn.lorawan.v3.GsNs/HandleUplink:01G9HFKRQMEBNFMENTVJ66E2TK",
    "rpc:/ttn.lorawan.v3.NsAs/HandleUplink:01G9HFKRY2MZJ1V8CGPCZD1MPW"
  ],
  "origin": "ip-10-100-7-40.eu-west-1.compute.internal",
  "context": {
    "tenant-id": "CgN0dG4="
  },
  "visibility": {
    "rights": [
      "RIGHT_APPLICATION_TRAFFIC_READ"
    ]
  },
  "unique_id": "01G9HFKRY79WJA9XGJ1ZB4DQZZ"
}

And when I do the post request using curl outside of TTN, it works ok and I see the endpoint is called. It seems there is a problem on TTN calling the endpoint.

That would be a massive breach of the Fair Use Policy - once every ~3 minutes at close range for 6 bytes would be the fastest you could do.

At medium range you may well be transmitting illegally.

As one of the greater loads on the infrastructure are the integrations you may well being rate-limited - but you don’t appear to have told us what the console log says as requested, only what one uplink is.

This may not be a good use for LoRaWAN but at the very least, it isn’t suitable for TTN at that uplink interval.

It will not be the same. It will be once or twice a day. Anyway, I see now some data on TTN but after a while no new data coming, which seems to be because of the limitation. But none of these data goes to the GCP endpoint.

I’m just now in the development phase. The other reason for using small intervals is that the downlink message doesn’t transfer quickly. I tested class C too, but again it was with a huge delay.

So, I will increase the interval to an hour. What is your suggestion for a fast downlink? We are a company planning to use LoRaWAN and need to know these kinds of limitations before going into production.

And what do you mean by console log?

Thank you

It’s not a limitation - well, actually, it is, to stop people consuming all the resources of the free service that communities use.

I have devices on my desk that I trigger a test uplink and before I’ve looked from the serial console it’s up on the web console.

The delays you are seeing are probably the device trying to keep to the legal duty cycle because it doesn’t want to see its owner being arrested.

2.4GHz radios, WiFi, pigeon - without knowing the application I’d just be guessing.

Not so much limitations but appropriate uses. If you are commercial you can test within the FUP policy on TTN but ultimately you should be looking at using a paid for instance that doesn’t have the FUP, just the law to restrict you. Plus a support desk that can dig in to the details (we are all volunteers on here).

https://www.thethingsindustries.com/docs/getting-started/console/

There’s a whole raft of information on there to tell you what’s going on - particularly the Activity / Live Data. If you’ve not already done so and you are developing a product, you should memorise https://www.thethingsnetwork.org/docs/lorawan/ so you don’t get too many RTFM responses to questions.

Thank you for the answer.

I don’t get what you mean by console. I see it, but there is no log there. I see the following in the live data tab. Do you mean sth else?
image

What do you think I should do now to solve my problem? Do I have to wait for some time to see data on my GCP again? Or I’m done? The new webhook I created is pending yet after 17 hrs.

You are still at every 20 sec, you are far exceeding legal limits, never mind FUP on a free service.

You are also going to run into battery life expectancy problems.

Looks like that was an hour ago for someone on CET.

No


You turned off the filtering and haven’t waiting for an incoming uplink :man_shrugging:

That said, I’ve never really taxed the FUP / rate-limiting on TTN so I’ve largely forgotten what to look for as events - and things have moved on in terms of the detail we get (as we are on a free service).

I’d strongly urge you to read the docs - learning LoRaWAN by osmosis doesn’t work so well.

1 Like

Hi again,

I waited for two days, and now I send data every 5 minutes, but I cannot join the network anymore. I deleted and recreated the new device several times, but it didn’t help. I also deleted and created a new webhook, but it has been in pending mode for two days. I know I did some parts wrong (short intervals, etc.). But what should I do now to solve my problem?
I turned on the verbose but could not see anything:

image

I just get “DevNonce has already been used” and here are the event details:

{
  "name": "ns.up.join.cluster.fail",
  "time": "2022-08-05T07:41:02.185287840Z",
  "identifiers": [
    {
      "device_ids": {
        "device_id": "lighting-1",
        "application_ids": {
          "application_id": "apollo-lighting"
        },
        "dev_eui": "2CF7F1203230F77A",
        "join_eui": "8000000000000006"
      }
    }
  ],
  "data": {
    "@type": "type.googleapis.com/ttn.lorawan.v3.ErrorDetails",
    "namespace": "pkg/joinserver",
    "name": "reuse_dev_nonce",
    "message_format": "DevNonce has already been used",
    "correlation_id": "4e2a510d945647d689a249ce6cac08e1",
    "code": 3
  },
  "correlation_ids": [
    "gs:conn:01G9P8N6RHFFF9F05X6ZD1RR1M",
    "gs:up:host:01G9P8N6RWRTP7T0P8K9KJQ48K",
    "gs:uplink:01G9PF6MTW895J06TZVZ7GWPG2",
    "ns:uplink:01G9PF6MTXPSHNPNT1QHKTYHDR",
    "rpc:/ttn.lorawan.v3.GsNs/HandleUplink:01G9PF6MTXX783YK43Q88FKRQG"
  ],
  "origin": "ip-10-100-4-177.eu-west-1.compute.internal",
  "context": {
    "tenant-id": "CgN0dG4="
  },
  "visibility": {
    "rights": [
      "RIGHT_APPLICATION_TRAFFIC_READ"
    ]
  },
  "unique_id": "01G9PF6MV9R7C5SXX3V9J3Q40R"
}

Select the End device, General Settings, Network Layer and Reset session and MAC state.

That should do the trick

1 Like

You are trying to debug too many things at the same time. To debug your webhook you can use simulated uplinks from the console. Any uplink should result In additional information in the live date view. Check the documentation on how to debug webhooks.

1 Like

It didn’t help.

Thanks for the answer. The webhook was working and suddenly stopped last week. I created the same webhook again, but it has been in pending mode for two days. I don’t get any log regarding the webhook.

I also created an account in The Things Industry which says I can test up to 10 devices, but I cannot find the console there to do everything from scratch :))

Reset you node (power off for at lease 15 sec) and while power is off reset the MAC.

1 Like

Same code, so you can expect the same problem. Plus issues getting on to the Discovery console may be ‘developer moving too fast’ syndrome - maybe check your email?

@kersing has the problem summarised and as I implied above, LoRaWAN is too complicated to just use some sort of hammer tactic to get it to work &/or in to your head. Compartmentalise each part and test seperately. And use a boring test endpoint website rather than have at it with GCP just in case there is something unrelated to GCP. Or perhaps just a simple typo.

2 Likes

I cannot find the console on The Thing Industry. So there is no code there yet.

I also created a new account on the community edition and another sensor. But still, I get the same message. Very strange.

image

The software is the same, the only difference is the tenant id.

Not strange at all - if the device isn’t confirming to spec by generating a new random DevNonce or a sequential one, depending on which version of the LoRaWAN spec you are using or the firmware is using or the combo thereof, hint, the spec versions need to match. The forum is littered with info on this if you care to use the search facility.

It also helps considerably if we know what the device is.

As for fixing your GCP issue, just use the uplink test facility to debug that and try a simple end point testing service.

Are you using the same AppEUI, DevEUI and AppKey?

Have you delete sensor in the other applications including TTI?

Thanks for the answer. The device is a custom board. First I have to get data from sensor to the dashboard, then I will go for the next step for webhook debugging.