Looks to me they are using the TTN network.
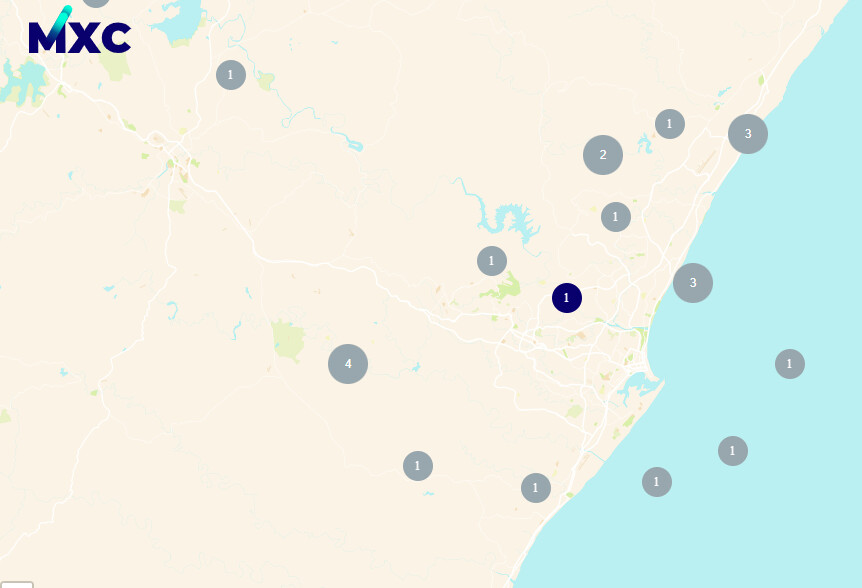
Their gateway location they offset the GPS location so it appears to be new sites. There are no ways that there are these many sits in Durban, also some of the gateways are in the sea.
Looks to me they are using the TTN network.
Their gateway location they offset the GPS location so it appears to be new sites. There are no ways that there are these many sits in Durban, also some of the gateways are in the sea.
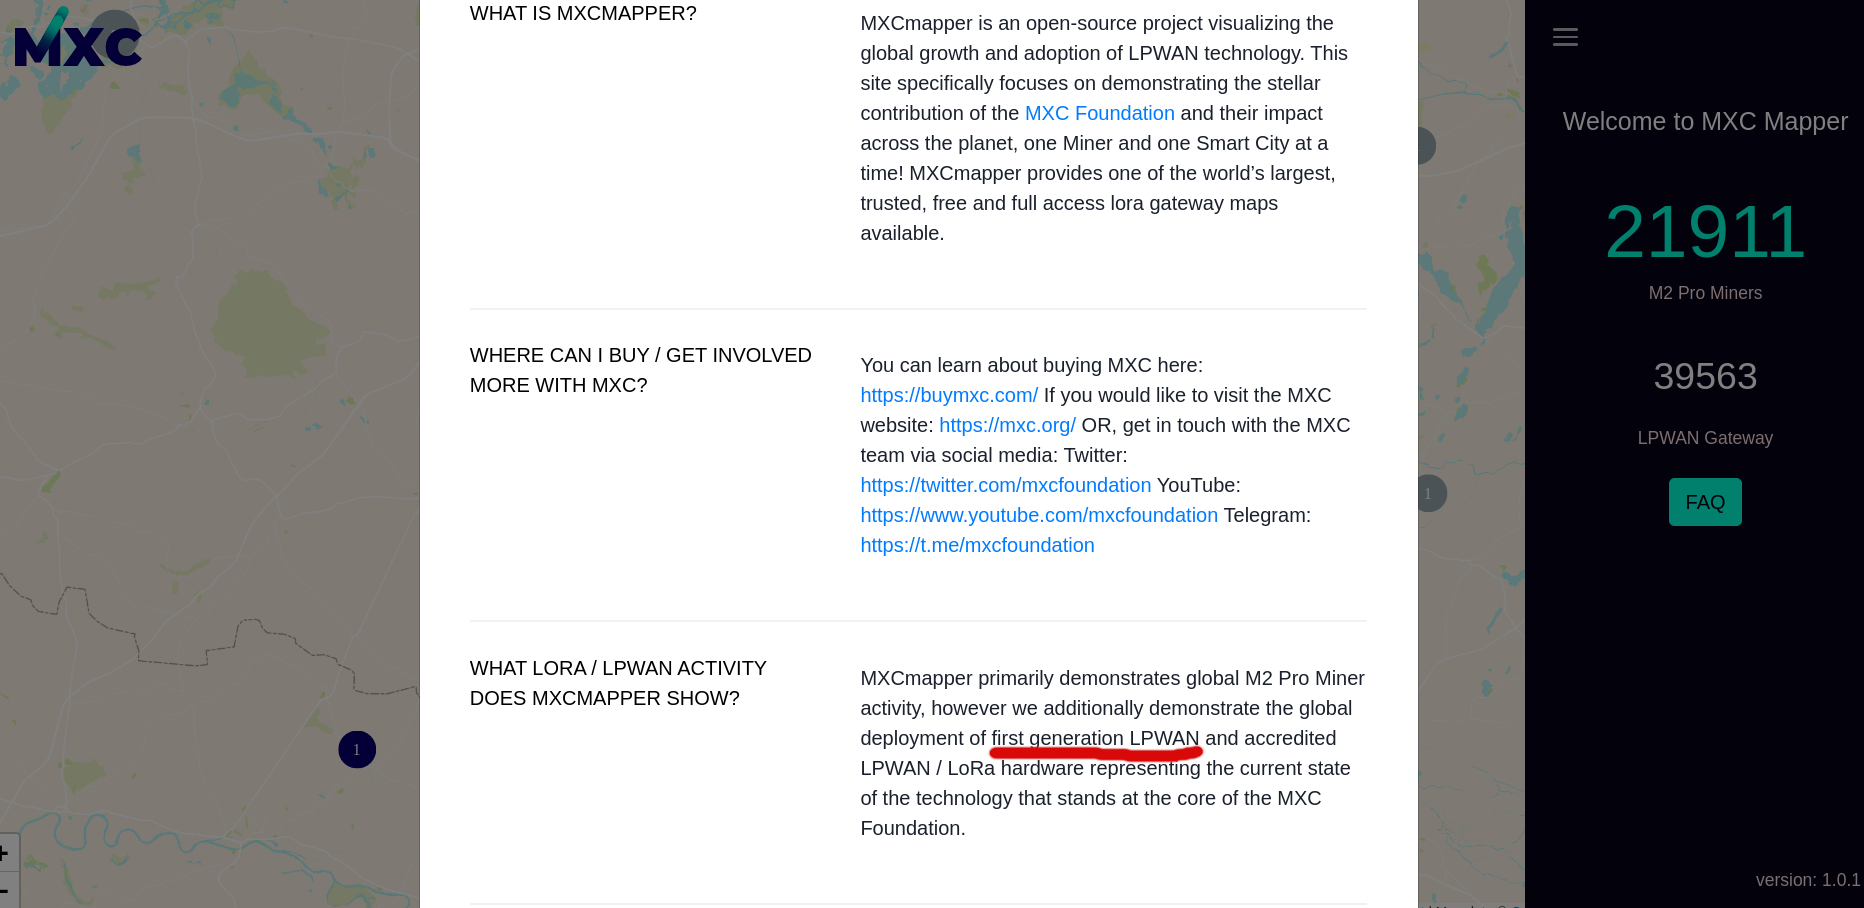
yes it seems grey is TTN (‘first generation LPWAN’), blue is MXC (allegedly, who knows…)
for your gateways in the sea, to paraphrase a conversation on the Helium discord ‘how can you be 100% sure that it is not a fish farm using LoRaWAN’
There are no way a fish farm in those rough sea and it is in the middle of the shipping lane.
MXC uses no form of ‘proof of coverage’ and there is no incentive to actually build good coverage. You could literally deploy 10 gateways under your bed and you’d earn the same as 10 gateways spread out on towers. Oh and the gateways are €2.5k 
Is the demand-side on the web3index just data transfer fees, or does it include some of the other transaction fees (like changing the location of a gateway)?
I had the same question, and it seems to be only data packet fees. The source code hits the ‘DC Burns’ API and takes the ‘state_channel’ element. These state channels are a so-called ‘level 2’ system to keep the details of the data traffic off the main blockchain, only pushing a summary to it at intervals, a few times per hour.
I’ve written a Python script to get an idea about the data packet volume, and i get around 12M packets for the last 24 hours, so in-line with what i mentioned above. Only about 10% of the 580k hotspots (58,860) saw any data traffic in the last 24hrs. 30% of all traffic is handled by 170 hotspots. A few hotspots take about 1% of total data traffic each (over 100k packets in the last 24hr each eg this one), all in Taiwan, probably a hardware manufacturer stress testing gateways/devices. I’ll put the script on Github later.
Looking at that Helium Durban coverage map I call bull!!! Our technology partners together with ourselves have deployed over 45 TTN gateways in the greater Durban area.
Although looking at their latest hotspot map, I do not see any in the sea.
After a bit of scripting (github) hitting the Helium blockchain API, it seems that, based on the last 7 days (hotspot is Helium speak for gateway):
Feeling sorry for the people trying to use LoRaWAN in that area.
I guess that the testers haven’t had the memo about it being tested already.
If they need to stress test a new concentrator card, a faraday cage is a much better option.
And if you dont have one of them, a simple 50R terminator on the antenna port reduces signal levels a great deal …
Having used both TTN and Helium, I must admit, Heliums onboarding interface is easier to use. They don’t have many options to choose from(no ABP activation for example) which simplifies things greatly. And best of all, I have coverage where I live in London, UK. 4-5 Helium gateways pick up my transmissions. At best, on TTN, I have only had one gateway pick up my transmission(apart from my own) and at best it happened very rarely.
About the issue of Helium traffic potentially causing congestion on the TTN network
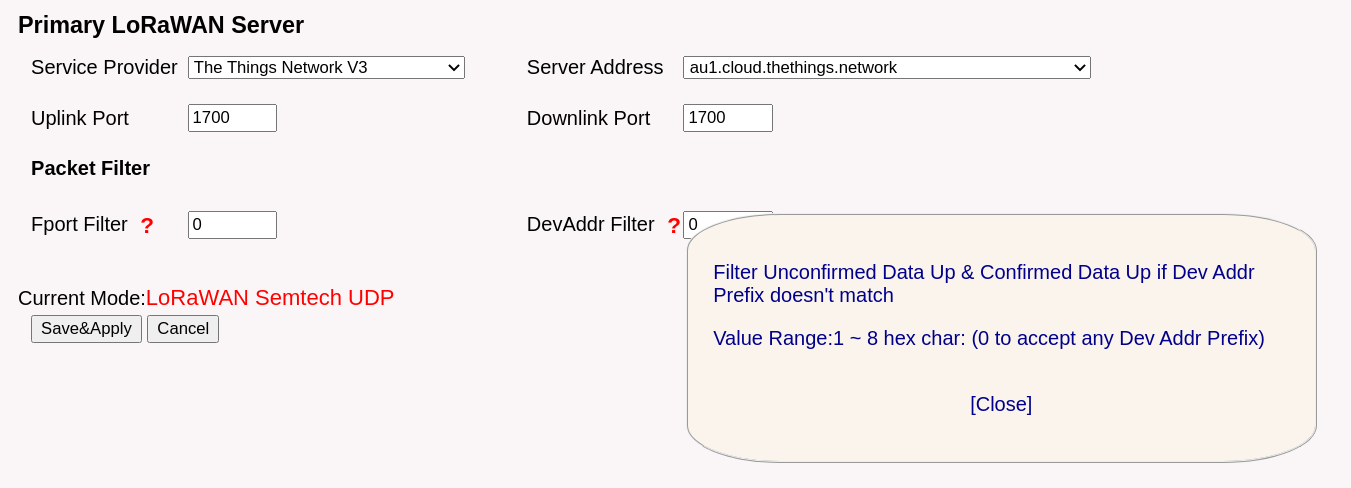
The Semtech UDP Packet Forwarder running on my Dragino LPS8 allows me to filter on DevAddr, so i could put 26 there to accept only TTN packets, correct? The Basics Station configuration does not provide such filter, or is it smarter by default? (it’s not stable on my LPS8 so i stopped using it)
You can put the filter value of “26” in there - but it doesn’t seem to work. Still all other data were forwarded to TTS.
Please dont as TTN kindly also allows use of e.g. experimental nodes which start 00 or 01 (under ABP? - I dont believe Helium allows ABP, only OTAA), also with systems like Packet Broker or other roaming mechanisms available in LoRaWAN land there may be ‘foreign’ devaddrs which will still be legitimately handled through your GW and then processed in the back end under roaming areements and then routed to their home networks and where in exchange the ‘foreign’ network also sees TTN & TTI addresses and routes them back home. Filtering would potentially break these arrangements as well as potentially breaking the TTN Manifesto permitting open fair access without technical or use case restrictions (which is what filtering would be), subject always to potential FUP enforcement. If you search Forum you will see filtering often comes up in discussions - typically every few months, and usually where someone wants to ‘protect’ their GW and only allow their own traffic vs full community access but they would still want to use the full backend services that are provided free for us all by TTI/TTN…
This has been discussed a number of times and generally is a bad idea (please search previous discussions for the reasons why). As LoRaWAN bandwidth is a fraction of a usual internet connections bandwidth is isn’t useful unless you are on a metered connection. And even then it’s a bad idea…
A further analysis of the 7,000 most active Helium hotspots that handle 90% of the real data traffic:
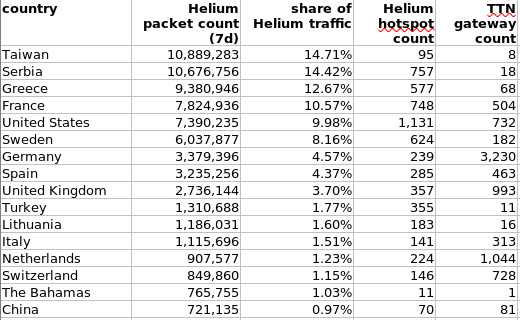
For the most active Helium countries (in terms of real data traffic), i compared with number of TTN gateways:
(note: i did not use the new TTN API for this analysis as i could not find the country in there, the old https://www.thethingsnetwork.org/gateway-data/country/ still seems to work)
Belgrade, Athens, and Paris seem to have dense and active Helium networks.
Great analysis @tomtobback, you’re preliminary interpretation isn’t surprising.
Brilliant work, shedding light on this. The concentration into a few (54?) hotspots might suggest clusters of hotspots where they are all seeing the same very active node(s) broadcasting and being very active generating apparently lots of traffic… how geographically dispersed are say the top 50,100, or 150 hotspots wrt activity?
Ultimately the killer for me here is your assessment that:
And this on a network they claim to be mining $millions per week across the full estate? How will all that HNT ever get spent and consumed (not least what has already been accumulated!), unless some clever person plans on cashing out some how (ponzi?). Note ‘net searching for HNT exchange and cashing in options seems to generate 10x links for buying HNT vs selling them  Unless there is some future volume method for using HNT for trade or other commercial transactions outside of using data on the Helium Network surely this is going to end in tears by bedtime? ( or is it that I simply don’t get all this crypto currency nonsense & hype?!
  )
)
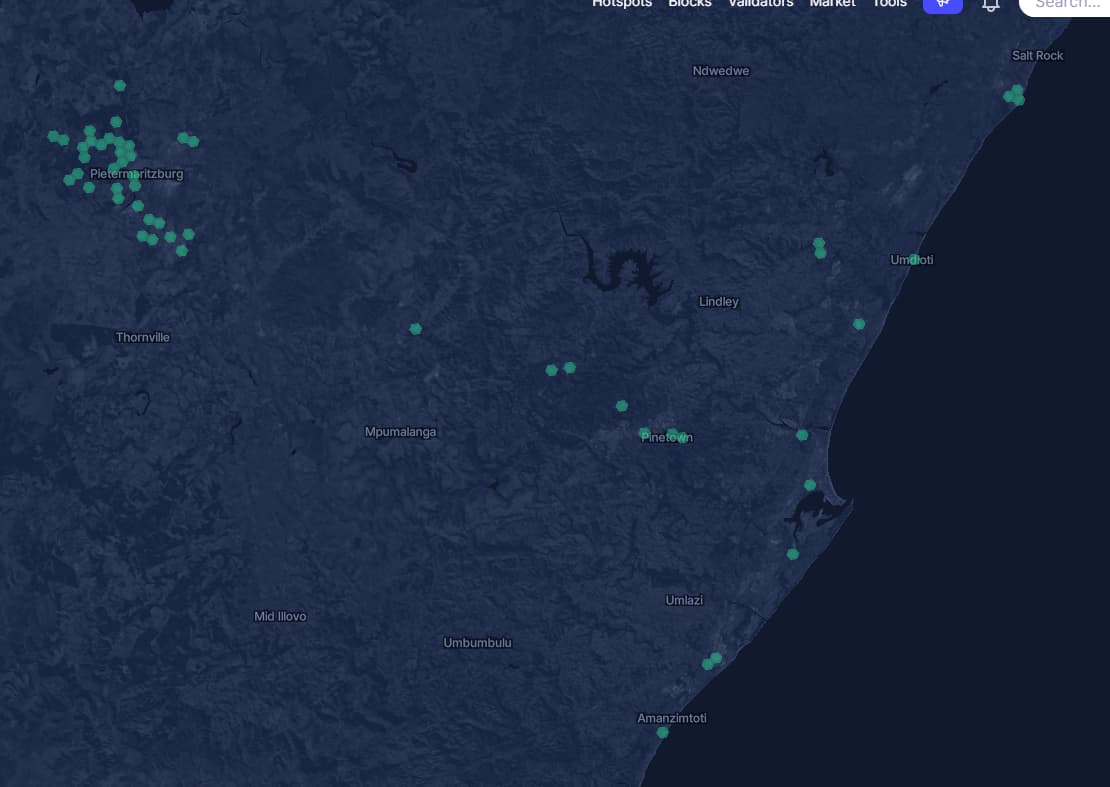
I commented on private thread to some of the other mods how there has recently been significant growth in coverage as shown on Coverage Map here in UK and near me, at least along major transport routes, suggesting increased real coverage, despite lots of fakes appearing late last year and early this…then disappearing again…I seen numbers ramping again over last week but sure many still fake/returning fakes…including the one that comes and goes virtually in my back garden! (I’m sure I would have noticed and which shows no coverage on the heat map despite fact I know it should cover some of the local tracks that the heat map indicates). Time for a chat with the neighbours!
That coverage map doesn’t seem to have many helium hotspots on it. Recommend checking out the community-run coverage mapping service at mappers.helium.com or the actual blockchain explorer itself at explorer.helium.com which shows the on-chain asserted location of the hotspots and their beacons.