Issue with uplink message forwarding from gateways to applications?

Is there any issue known why uplink messages received from my ABP device by my gateway are not reliable forwarded to my application?

Since Friday there are issues, thought in the beginning the battery is too low, had replaced it. After inserting, the initial frame 0 is received and forwarded, but then issues are raised up and part of further messages got lost. Didn’t found a pattern so far, have recreated application (one time) and device (many times) this will not help.

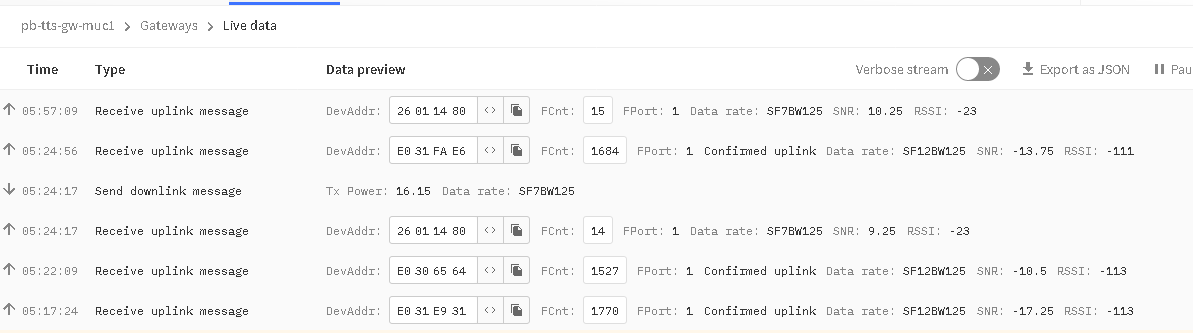
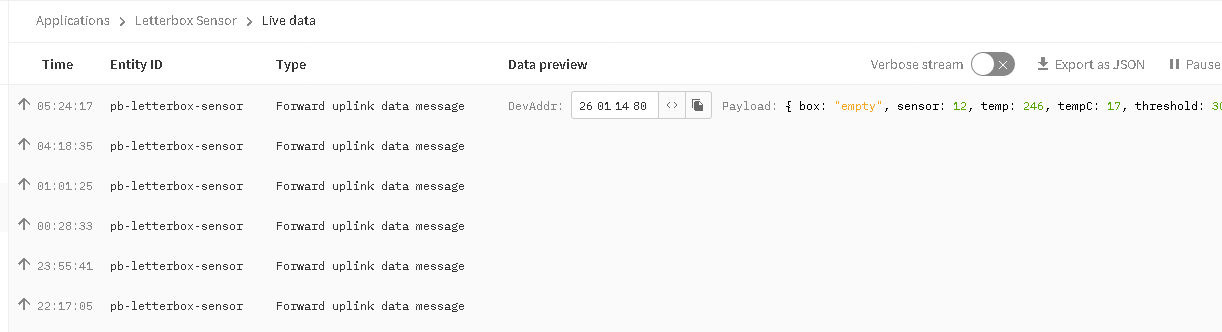
Once happen, I see the uplink message in the “live data” of the gateway, but no related entry in “live data” of the device.

Looks like the routing in the backend drops messages somehow or can’t dispatch proper…

BTW: sensor is sending only every 30 minutes, message loss rate between gateway and application feeling wise > 50%.

How can this be traced further?

Did you add all frequencies the device transmits on to the device network properties? If TTN receives an uplink on a frequency that is unknown for the device the uplink will be dropped and not forwarded to the application.

Some additional information like a screenshot of the gateway console with a message that didn’t make it to the application and a screenshot of multiple uplinks in the application console might provide us with additional information on what could be happening.

Here the screenshot of my gateway which is even receiving messages from others.

my device has DevAddr 26011480 and here frame 14+15 is shown

The application misses some, e.g. the last frame

Checked used frequency, can’t see that one is used which is not defined:

Frame 14:

        "mac_payload": {
          "f_hdr": {
            "dev_addr": "26011480",
            "f_ctrl": {},
            "f_cnt": 14
          },
          "f_port": 1,
          "frm_payload": "***"
        }
      },
      "settings": {
        "data_rate": {
          "lora": {
            "bandwidth": 125000,
            "spreading_factor": 7,
            "coding_rate": "4/5"
          }
        },
        "frequency": "868100000",
        "timestamp": 1782890299,
        "time": "2023-09-27T03:24:17.450707912Z"
      },

Frame 15 which was not forwarded:

        "mac_payload": {
          "f_hdr": {
            "dev_addr": "26011480",
            "f_ctrl": {},
            "f_cnt": 15
          },
          "f_port": 1,
          "frm_payload": "***"
        }
      },
      "settings": {
        "data_rate": {
          "lora": {
            "bandwidth": 125000,
            "spreading_factor": 7,
            "coding_rate": "4/5"
          }
        },
        "frequency": "867300000",
        "timestamp": 3754415139,
        "time": "2023-09-27T03:57:08.966722965Z"
      },

End device has configured (overtaken from v2)
grafik

All worked well since 2019…until Friday

As I’m recording all raw data since 2019 on webhook server side I was able to run a statistics by frequency

Frequency use statistics from 2023-01-01 until now:

   1353 "867100000"
   2078 "867300000"
    659 "867500000"
   2218 "867700000"
   1140 "867900000"
   1263 "868100000"
   1154 "868300000"
   1464 "868500000"

But since 2023-09-23 only following

      8 "868100000"
     17 "868300000"
     27 "868500000"

Last frequencies < 868 MHz seen to be passed to application on 2023-09-22:

      6 "867100000"
      5 "867300000"
      1 "867500000"
      2 "867700000"
      6 "867900000"
      4 "868100000"
      1 "868300000"
      3 "868500000"

Particular the very last one with 867 MHz on 2023-09-22T14:36:02.700175046Z, around that time when problems turned starting.

Also analyzed the frames which are not passing and they have frequency 867 MHz

Related to frame 14 passed, but 15 missing (even 16):

[
  14,
  "868100000"
]
[
  15,
  "867300000"
]
[
  16,
  "867300000"
]

Have also checked via CLI current device settings:

    "uplink_frequency": "868100000",
    "uplink_frequency": "868300000",
    "uplink_frequency": "868500000",
    "uplink_frequency": "867100000",
    "uplink_frequency": "867300000",
    "uplink_frequency": "867500000",
    "uplink_frequency": "867700000",
    "uplink_frequency": "867900000",

see no reason why message is not delivered if uplink message is using 867 instead of 868 MHz.

See guidance from Jac above - you may have set the frequencies in the device firmware and it may be transmitting fine but did you EXPLICITLY tell the LNS via the device console at time of registration that you were using the full set (beyond the 3 mandatory channels assumed for the freq plan under LoRaWAN specification). This must be done as part of device settings when using ABP, IIRC there were some reports(#) where adding/changing after the fact - e.g. via command line didnt always work so best (re) done at time of (re) registration… If using ABP did you fully reset session/MAC state in Console after changing the batteries etc.

image

(#) I may be misremembering - it was a while back!

Thank you so much for your hints!

BTW: I’ve triggered a “Reset session and MAC state” after battery replacement, that didn’t help.

Now I’ve added as suggested all so far seen frequencies to that “Factory preset frequencies”. Now at least 2 messages were delivered using 867 MHz!

I have no clue why this worked before since migration from v2 longer time ago until battery replacement on Friday. Potentially this “Reset session and MAC state” reverted some former defaults to newer defaults.

Found now also related hint here:
https://www.thethingsindustries.com/docs/devices/mac-settings/

This topic was automatically closed 24 hours after the last reply. New replies are no longer allowed.