I have a Dragino LWL1 water detection sensor, sending data to a RPI Lora Gateway with a SEED WM1302 module.
Gateway connected an last activity timer confirm that data is send and received. But live data is often not visible. Then al of a sudden i see data, in the live view? but no idea what triggered it. Now i once again don’t see any live data.
any suggestion what might be wrong?
Maybe nothing is wrong - you only see live data in the console, nothing historical unless it was in the last few minutes when you open the console.
TTS is not a database, it is not expected to hold data for you. Have you setup an integration to send the data somewhere for you to process?
That is right but when i trigger the sensor i see the RPI receive data and the packet forwarder sends it to the TTN. Despite the console being open in my browser i don’t get anything. I want to forward the message to an mqtt broker but i first want to see the data and use the payload formatters to cleanup the data. The strange thing is, from time to time it does work, but often it does not.
I had the whole setup working last year incl MQTT broker and client via node red that would send message and play a sound when water was detected. But i can’t get it to work properly again.
Are you using ABP or OTAA to authenticate the device?
Have you replaced the battery on the device?
And what do you see in the gateway consol?
The device Dragino LWL1 uses OTAA. And i have put in a new battery.
Is that just now or previously?
I Measured the voltage of the previous one and it was 3,04v. So it should have been OK. But to make sure I put in a new battery.
That just means your connection between the TTN servers & your web browser has broken - it has no bearing on your uplinks.
What is the purpose of using confirmed downlinks? It adds an extra burden to the device that already has a very very very small battery - so much so that the latest version of that devices no longer uses a coin cell.
What do you see in the device console if you leave it open for a while?
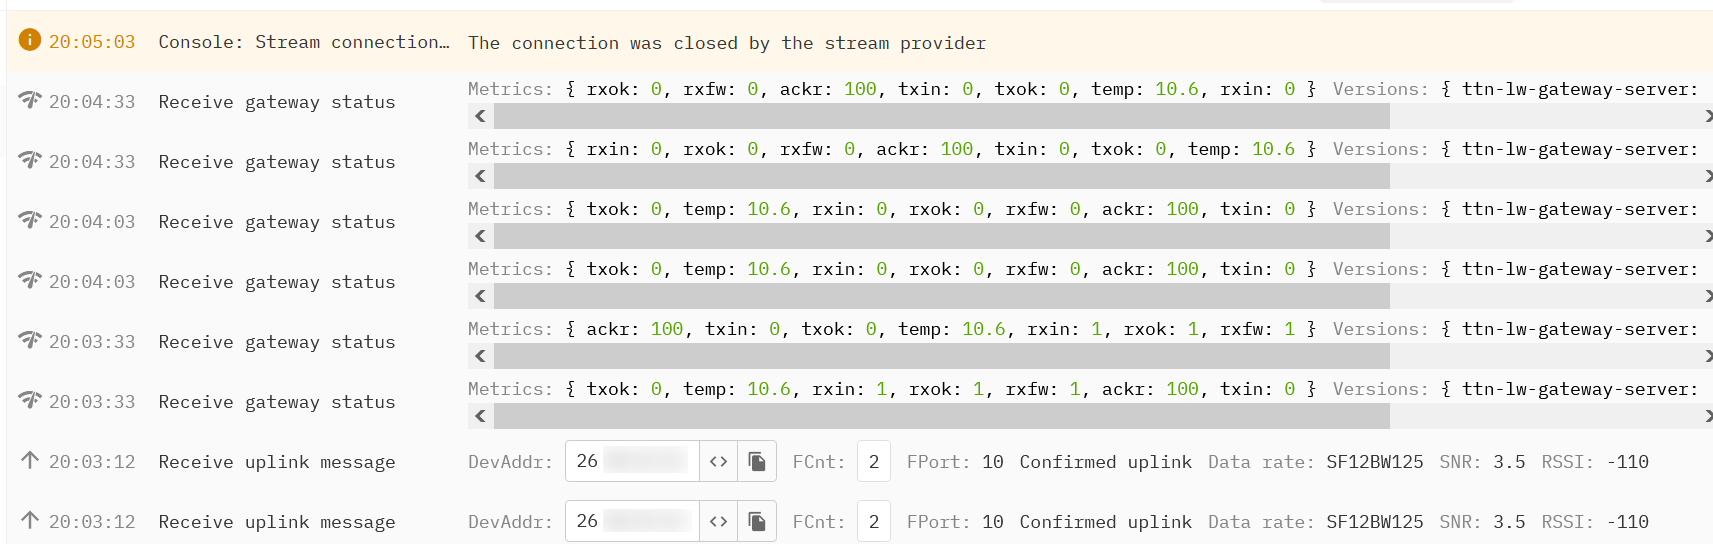
Yes i understand that the last message means that the connection between the server and the browser is lost. What i don’t understand is why I don’t get any message at all until i get all the messages in one hit including the one “Console: Stream connection. The connection was closed by stream provider”.
This are some messages form Gateway.
On the device console i don’t get anything
This isn’t something the forum has seen before - and I’ve read everything in the last 1000 days.
I note you are getting duplicates of an uplink but due to the redacted DevAddr (which is not a security issue so no need to block it out), I can’t the sure they are duplicates.
Do you have any other devices that are working normally?
If you cycle the power on the device do you see the normal join request - accept sequence?
The console relies on JavaScript running in the browser, are you using something that might interfere with JavaScript? Or is your browsers connection to the internet using a proxy that might be buffering?
When i power cycle the dragino LWL01 device i get the following from the packet forwarder console output
< Redacted: LoraConsoleAfterPowerCycleDragino.txt >
Sadly enough, i have only the dragino sensor, and another DIY sensor I have to programm myself “elektor Lora Node V3.2 180516-91”
But i first would like to get a basic sensor working before want to start playing with my own node
Please posts logs using the </> tool - links to random files are only appropriate if they can not be showing in a post using the normal tools.
I’ve tried Firefox, Chrome and Edge no adblocker or cookie blocker active, all give the same result
It would be more useful to see what the gateway & device console show as we can not validate any of the information in the log. There are two uplinks with f_cnt 0 showing and there are few people here with time on their hands and the expertise to try to decrypt potential Join Requests or a device that has cycled it’s power, is on ABP and has not reached the f_cnt for the LNS to accept it’s uplink.
Why? No harm will com to the elector node and you will have far more control over it than a small coin cell operated device that may well be draining the battery on each Tx that it is unable to maintain function to hear the Rx
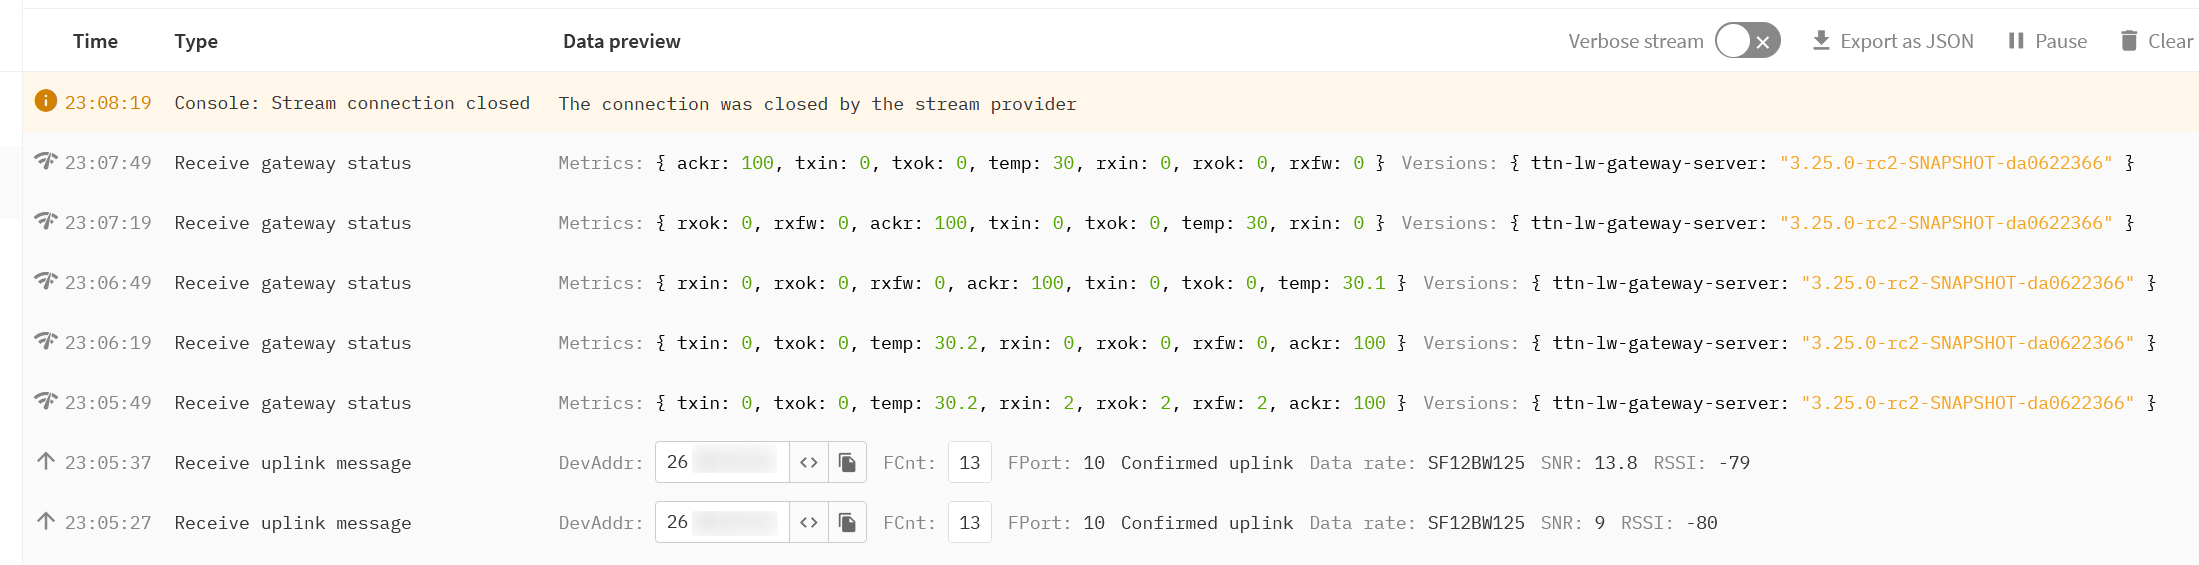
No proxy in use? Because the lines showing when the connection is closed looks like something is buffering data until a close and then forward it.
![]()
If this is your node/sensor, how far is it from the gateway?
SF12 is a very low data rate.
If you are certain this is your node/sensor try to integration and then look on your node-red (node-red - mqtt → debug node) and see if the data appears there (long shot)
To me it would rather appear there is something wrong with the node registration, key??