Hi,
I’m try to understand why some lora msg are loose on the path from the nodes to the application server.
For this purpose I configured 3 nodes to temporary publish uplink msg every 5 minutes.
The lora msg are received by a lorank8 gateway running poly pck connected to TTN by a Teltonika 4G.router.
This is an example related to some lost msg that don’t arrive to the application server in a time window around 6:10-6:15.
Analysing the lorank8 log file, I found that there is some degradation both in “Upstream datagram acknowledgment quality for server “eu.thingsnetwork.org”” and in “Downstream heart beat acknowledgment quality” parameters, as reporte in this graph.
The 4G router seems to operate correctly on a 4G network with a stable signal of -75db reported in light yellow, the other yellow line is the mobile IP change
As an integration, I switched the gateway from the 4G router to my home ADSL router and the problem around 10:20-10:30 from the gateway log analysis seems related to the poor quality of the ack, like the mobile internet connection.
Could be the network the problem or there could be other reason for the loose of lora msg ?
Thanks,
Gianluigi
It seems TTN is experiencing load issues with the UDP based packet forwarders. Lately I’m seeing frequent issues with gateways that have been stable for well over two years where the ‘last seen’ isn’t updated for a couple of minutes.
Hopefully they’ll be able to resolve the issues soon…
A work around would be to switch to another packet forwarder, my Lorank is running MP forwarder (using Balena.io) and I haven’t noticed any issues with that setup. (I am the author of MP forwarder so I might be biased)
The source includes a build script for RPi which you can use as starting point. Or if you don’t mind using balena.io I could dig out my build definition for it.
I’m afraid I haven’t enough knowledge for implement both of these solution.
But If, as I imagine, trying to build the pck-fwd by the RPi script doesn’t rapresent a risk for the current lorank functionality, I could try this way.
Hi Jac,
before try the script way, I take a look at balena and your presentation at https://github.com/kersing/gateway-workshop, very interesting approach.
I’m wondering if the step related to writing a balena OS image on the RPi SDcard could be also applied to Lorank without loose its current functionality.
As far as I know balenaOS needs to replace the currently installed OS so using it will be destructive. (If I recall correctly the image you write to sdcard automatically replaces whatever is currently in the on board flash, just checked and the documentation states it will wipe everything on the eMMC)
So there is no easy way to test while keeping the existing software available, sorry.
Starting from the build-pi.sh, as you suggested, I was finally able to build the mp_pkt_fwd for lorank and it works fine.
Using two lorank in the same site, one with poly and one with mp pkt_fwd, give anyway some data lost in specific time windows that, analyzing the gw log file, seem originated on the TTN server side overload.
In order to understand the possible origin of missing data in the application server, It could be useful to have a software that analyze the gateway log file and extract the status of quality parameters (i.e. heart beat) over the time.
Do you know if there is something like this available ?
Thanks,
Gianluigi
I thought the output of such a software could help the community users to better compare the problems they experience on a specific time window, understanding in a post analysys if it was a local own problem or if it could be a TTN temporary issue.
Of course it will also be better if the quality connection data could be collected from (some sentinel ?) gateways close to realtime on a common platform.
These status picture could help in realtime both the users and TTN operators.
At the moment is only my fantasy … may be I’ll try to do something about it.
Thank you for your support,
Gianluigi
I own 13 active gateways spread though NL and one thing I’ve learned over the past (almost) 4 years is gateways are remarkably stable. No need to check the log files (if at all possible, some gateways can’t be accessed remotely).
The TTN console in combination with one heartbeat node (with MQTT subscriber listening) is sufficient to debug almost all issues and check if the network is experiencing issues.
Analyzing it for TTN is of no use, TTN is aware there are hiccups in the community network. The freely available network does not have an SLA so things will not change based on analysis.
I confirm that also my gateways are globally stable, only lately they show some issue and this is the reason I’d like to monitor their link to TTN.
I started reasoning from my tiring manual gateway log analysys related to a past time windows, but as you suggest it would be a better solution to monitor the heartbeat (may be also the upstream ack) of one or more nodes and optionally store them.
I didn’t know about their avalability, are them already published by mqtt or it’s something that should be implemented ?
Gianluigi
Hi Jac,
I’ve a downlink problem with mp_pkt_fwd I build for lorank.
If I set this packet forwarder in the “forwarder” file, a things node is no able to join TTN, while switching to poly it works.
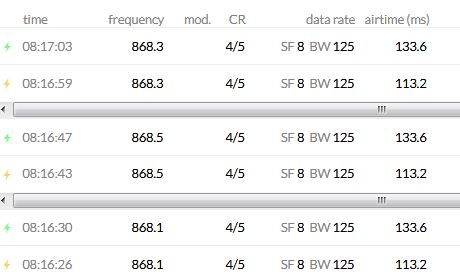
It seems that using mp, the node isn’t able to receive the join-accept published by TTN, entering in a join-request/ join-accept loop that on the TTN gateway console result in:
The related daemon.log is.daemon.txt (29.1 KB)
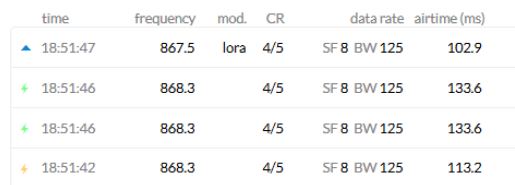
Switching to poly the node correctly joins TTN:
It could be something related on how I build the mp_pkt_fwd for lorank ?
Thanks,
Gianluigi
I inserted the additional parameters in local_conf.json: {“gateway_conf”:{“debug_jit”: true,“debug_jit_error”: true,“gateway_ID”:“aaaaaaaaaaaaaaaaa”,“ref_latitude”:4.811231,“ref_longitude”:9.200628,“ref_altitude”:420,“contact_email”:"",“description”:"",“beacon”:false,“logger”:true,“upstream”:true,“downstream”:true,“statusstream”:true,“stat_format”:“semtech”},“web_conf”:{“username”:“root”,“password”:“xxxx”}}}
The associated log is daemon150919.txt (71.0 KB)
Inside it, there are these additional info: x_start_delay=1495 (1495.500000) - (1497, bw_delay=1.500000, notch_delay=0.000000) rc/mp_pkt_fwd.c:1671:thread_jit(): lgw_send done: count_us=65705652
 upvote for the mp-pkt-fwdr