Here’s something that @johan and me have been working on. Originally for a workshop at SXSW, but this should be useful for more people that do TTN workshops…
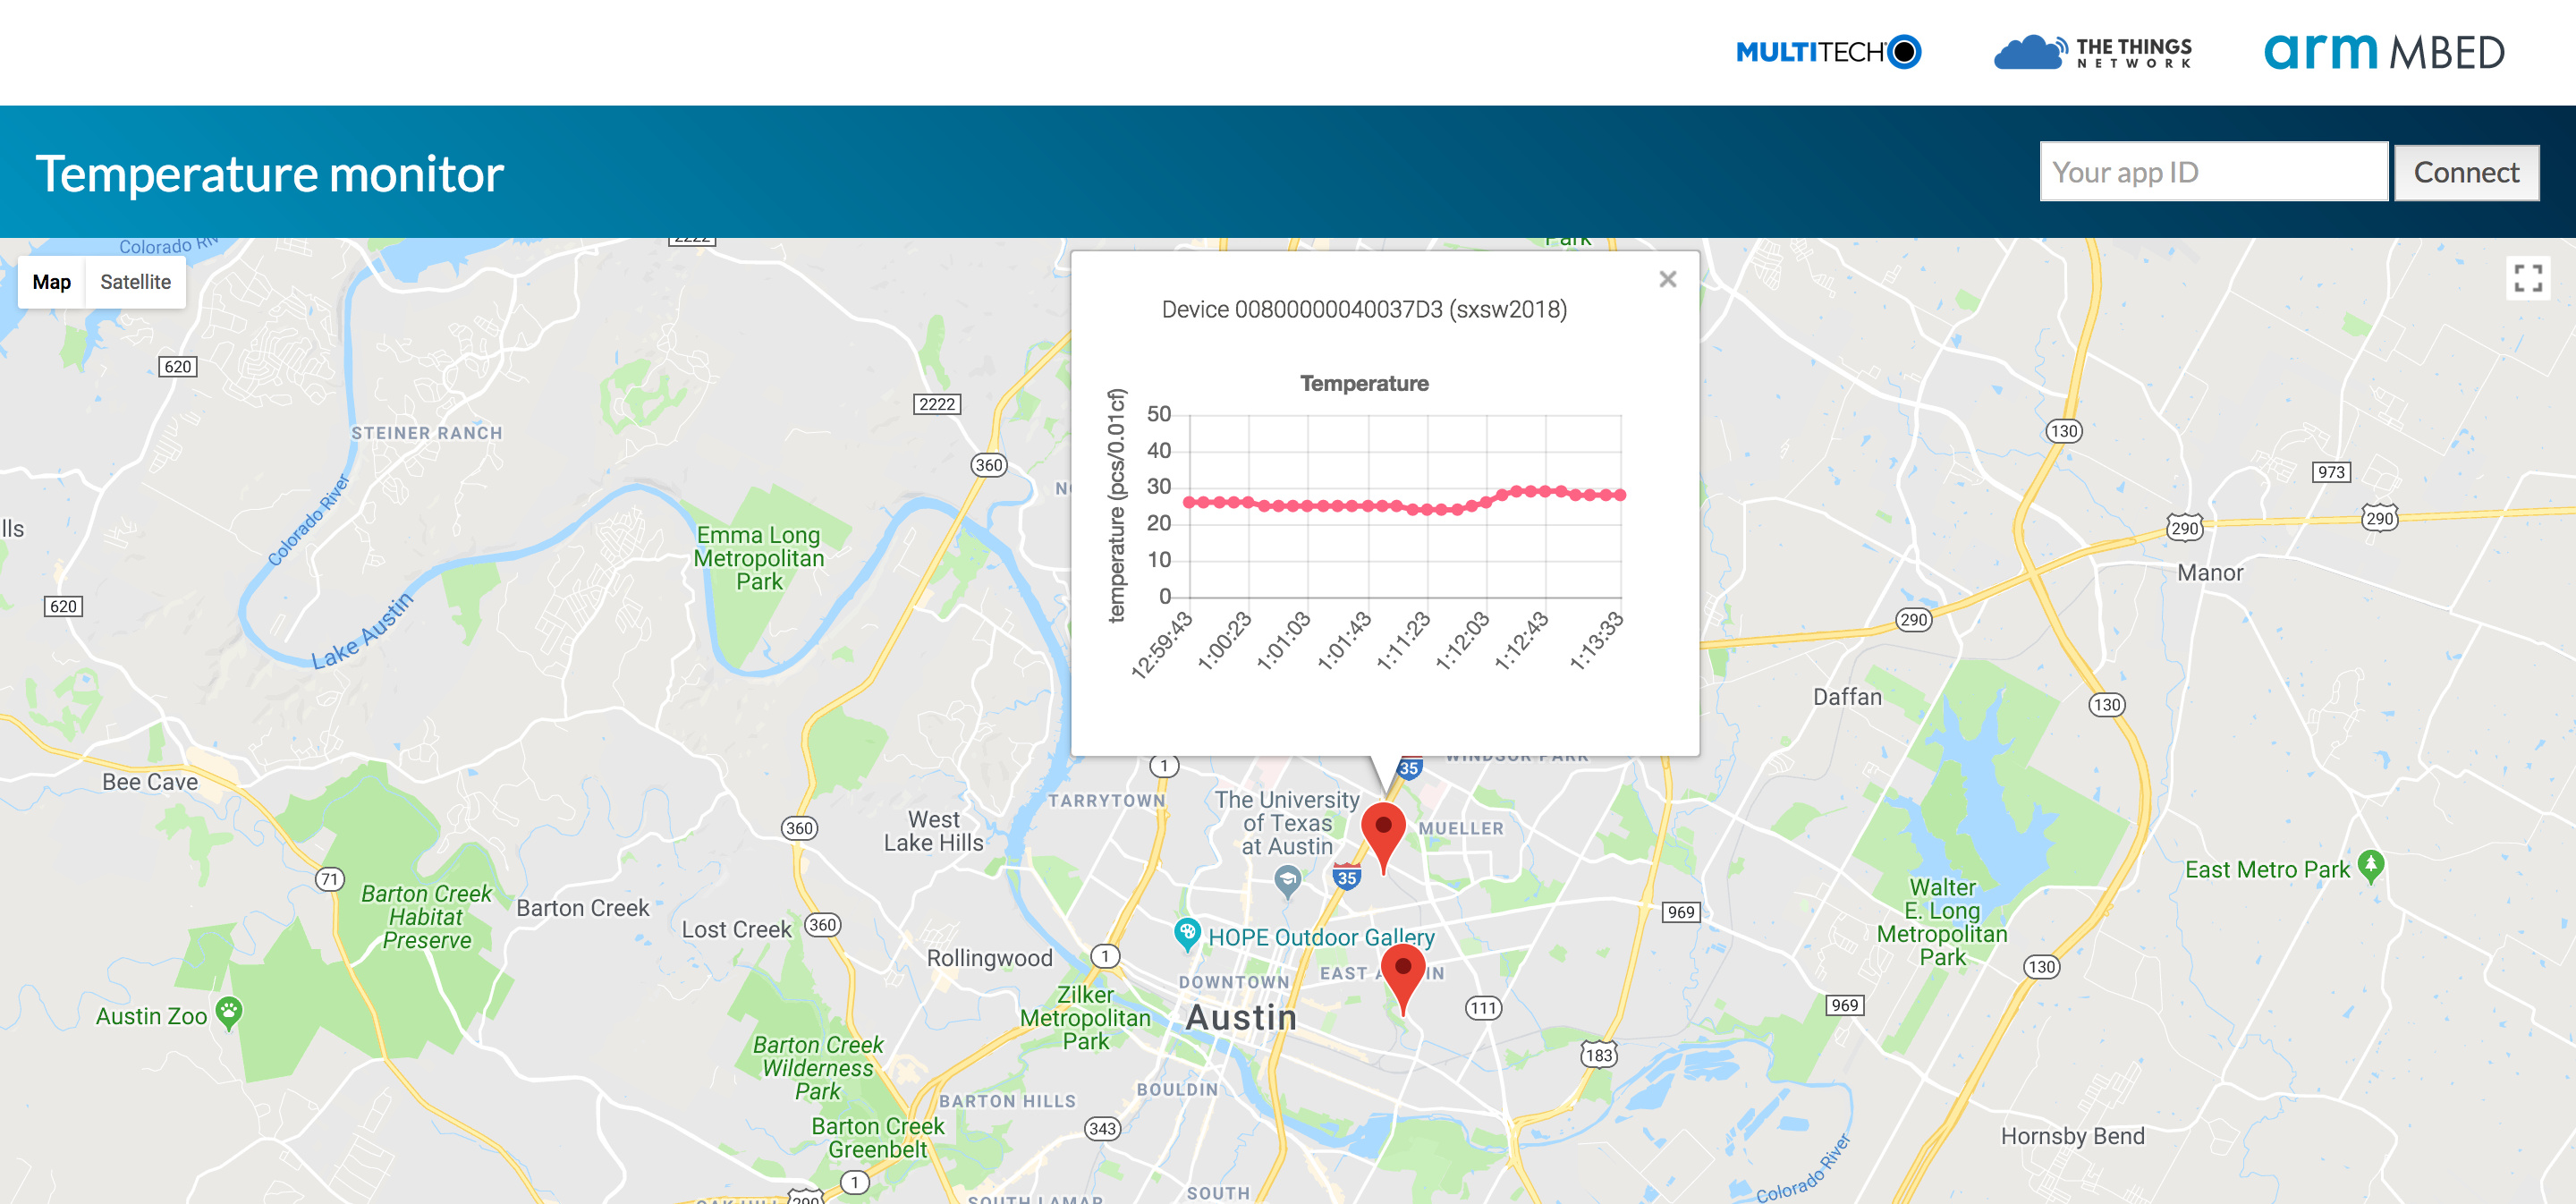
Data gets a lot more exciting when you can visualize it. Our new project makes it easy to plot sensor data from LoRaWAN nodes connected to The Things Network on a map. Because everyone can add their sensors by just providing an API key, it’s very useful for workshops or introductions to LoRaWAN. The maps work on desktop and mobile, and data is automatically synchronized between clients.
The great thing here is that it’s not tied to a single TTN account. Everyone can key in their application credentials and we’ll show all sensors on the map. Graphing is done automatically and can support multiple sensors and graphs.
I really like this - good work. Would you please just extend the readme on your github to include details about the node used and default data format? - Thanks!
Thanks, I understood the bit about how to extract data in the config section of server.js. I was asking for some more detail in the github readme, explaining which node was used (was it the TTN sensor node?) and how, for example, nested JSON data might be handled - payload_fields: {
barometric_pressure_2: 82.9,
gps_3: {
altitude: 2,
latitude: 53.2852,
longitude: -2.4695
},
temperature_1: 24.1
}
Again, thanks very much for developing a useful example
Hi,
I have tried this application and it is really good. thanks for sharing…
My sensor has GPS payload and I would like to change the marker depending to the device payload at the time but couldn’t figure out how to… I was able to get the altitude plotted to the chart though.
In your read me file in git you mentioned about setting the lat and lng properties and emit a location-change? don’t understand how exactly how this is done. tried replacing these variables with payload_fields but still couldnt get it to work… if you could give me specifics what code line number in the server.js should I modify, that would be very much appreciated… sorry for the trouble as I am a newbie in javascripting and my work is more on hardware. tah…