No downlink (observed at OTAA) when gtw_id is missing in uplink

I have an OTAA and downlink issue:

Every now and than I have the problem that I cannot get a join accept from the network.
It happens to multiple devices. Both self made and using RN2483 and commerical like the xignal mouse trap.

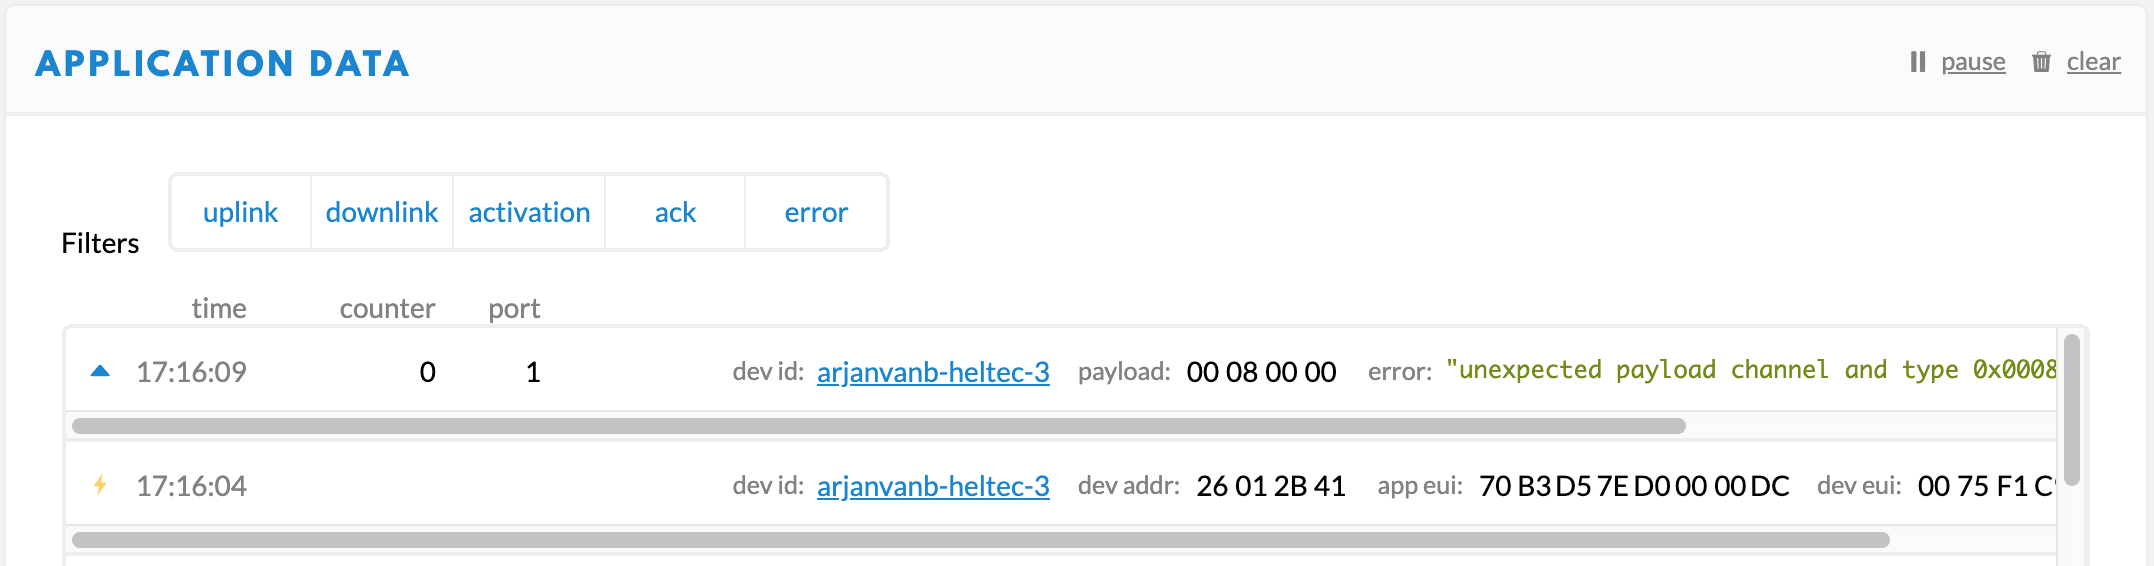
I do receive a good OTAA join request in my application but the device never receives a join accept.
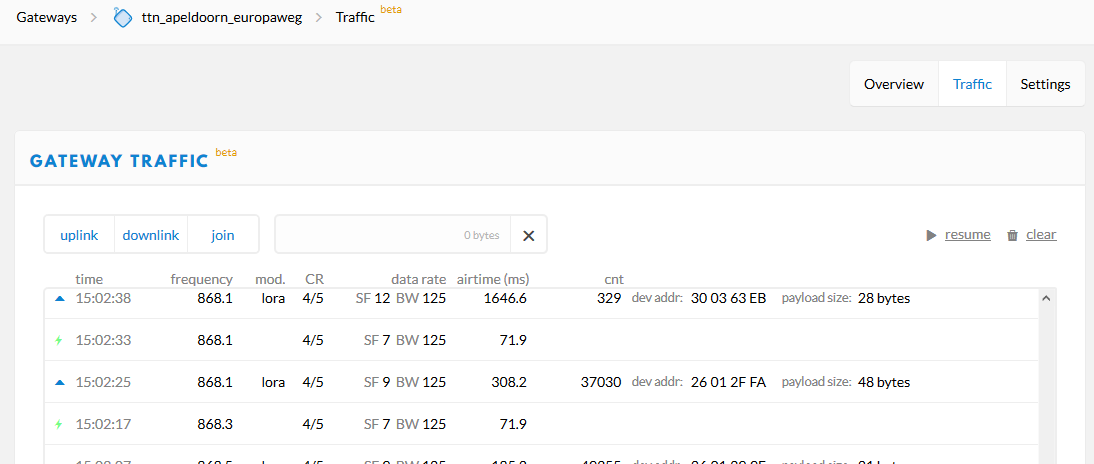
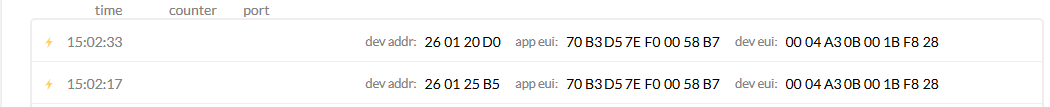
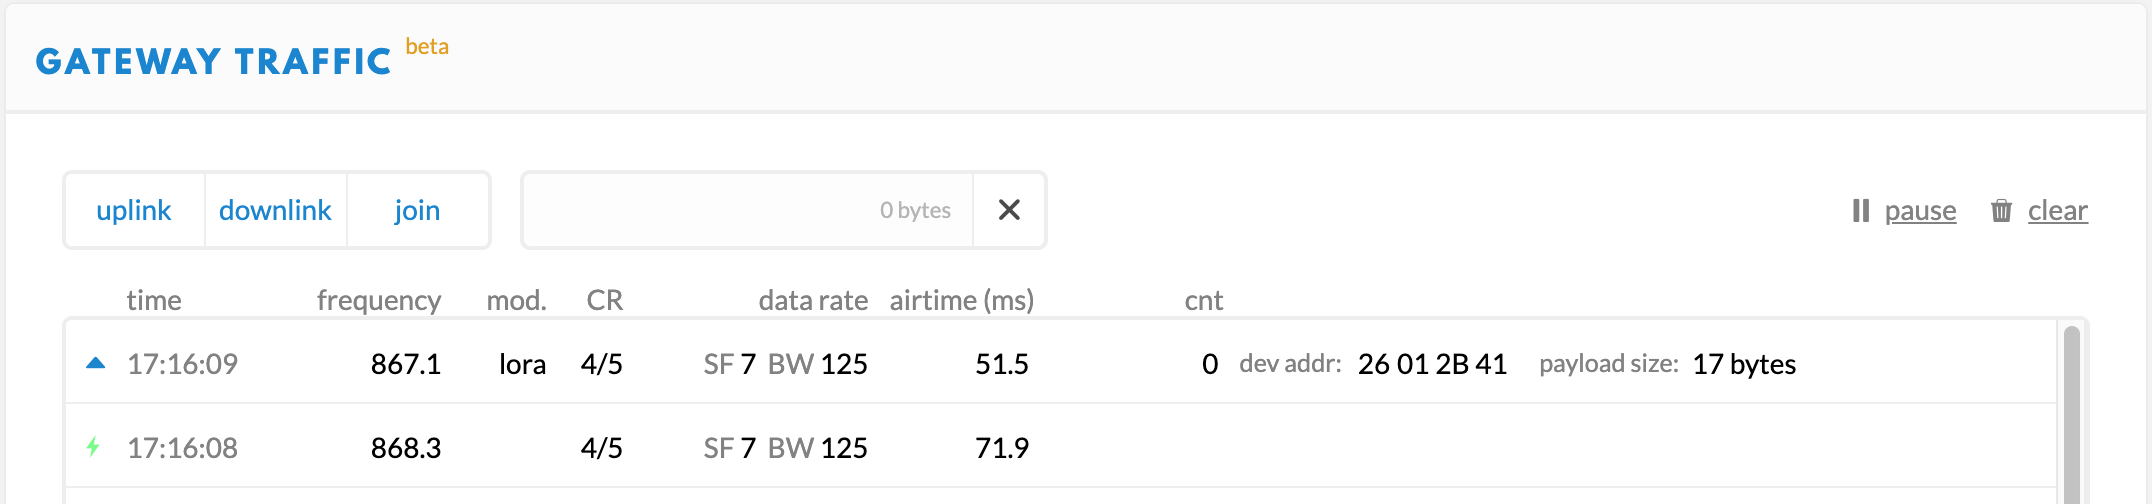
When this happens I see always that the strongest gateways, that shall be selected to send join accept, have no gateway-id: (See below)

Evidence of occurring phenomena captured from console in application data:

{
  "time": "2019-10-21T17:52:01.998784717Z",
  "frequency": 867.9,
  "modulation": "LORA",
  "data_rate": "SF12BW125",
  "coding_rate": "4/5",
  "gateways": [
    {
      "timestamp": 512377268,
      "time": "2019-10-21T17:52:01.945049Z",
      "channel": 7,
      "rssi": -109,
      "snr": -7.25
    },
    {
      "gtw_id": "eui-0031552048001a06",
      "timestamp": 1738476220,
      "time": "",
      "channel": 1,
      "rssi": -101,
      "snr": -16.5,
      "rf_chain": 1
    },
    {
      "timestamp": 11735132,
      "time": "2019-10-21T17:52:01Z",
      "channel": 1,
      "rssi": -71,
      "snr": 9,
      "rf_chain": 1
    }
  ]
}

It is an intermitting fault that has happend several times over the last weeks (may be months).

In slack I raised the same question in OPS (https://thethingsnetwork.slack.com/archives/C1Q5XLNDT/p1571680789040000) and the responces make clear that we have a serious issue that is real.

Who else has this issue? Please comment your observations on this topic to get a good overview of the issue and indication of the size. Thanks.

My question to TTN or TTI is to look in to this issue and solve it.

3 Likes

I’ve never seen a receiving gateway listed without it’s EUI, which handler are you using?

Perhaps the gateways in question aren’t correctly configured with TTN, I’ll try and replicate this issue on my end.

I’ve seen data with no gateway information on one packet and with gateway information on the next without any changes to the gateways. This is an issue in the backend as I’m experiencing it with Kerlink (stock firmware), TTIG and multiple gateways running MP forwarder.

2 Likes

Same problem here with some OTAA nodes happened several times over the last weeks and we are also having some problems with ABP.

1 Like

Currently I observe again the issue that I do not receive Join accepts form the network.
I do receive join requests but message in console is incomplete:

{
  "time": "2019-12-07T13:52:32.865104906Z",
  "frequency": 868.1,
  "modulation": "LORA",
  "data_rate": "SF7BW125",
  "coding_rate": "4/5",
  "gateways": [
    {
      "timestamp": 79057475,
      "time": "2019-12-07T13:52:32.80233Z",
      "channel": 0,
      "rssi": -119,
      "snr": -1,
      "rf_chain": 1
    }
  ],
  "latitude": 52.183002,
  "longitude": 5.9425883,
  "altitude": 2,
  "location_source": "registry"
}

I do see the uplink message in the nearby gateway:

afbeelding

and in the application:

afbeelding

But no downlink message containing the join accept.

Can TTN please investigate?

The green icon in the gateway Traffic is actually the Join Accept, which TTN should/will have forwarded to the gateway.

On the very same gateway Traffic page for a The Things Gateway, today, I don’t see an orange icon for the Join Request either. Just like in your screenshots, an orange Activation icon is shown in the application’s and device’s Data page, indeed showing no gtw_id there. (On that page, it also shows the assigned DevAddr, implying that TTN accepted the Join Request, just like in your screenshots above.)

For me, the timestamp for the green icon is about 4 seconds later, perfectly in time for RX1 which is 5 seconds. Also, for me the device actually joins fine, despite indeed not seeing that gtw_id right now. In your screenshots, the timestamps for the orange Join Request Activation and green Join Accept are about the same? Any chance there’s a lot of latency for your gateway? What type of gateway is this?

Also, right now, it seems that on an application’s Data page the gateways array for a Join Request an Activation is always less verbose than the same thing for an uplink.

Join Request Activation on application’s Data page:

  "gateways": [
    {
      "timestamp": 1775046043,
      "time": "2019-12-07T16:03:42Z",
      "channel": 2,
      "rssi": -42,
      "snr": 6.75,
      "rf_chain": 1
    }
  ]

Uplink, for very same application and gateway, on application’s Data page:

  "gateways": [
    {
      "gtw_id": "arjanvanb-gw-1",
      "gtw_trusted": true,
      "timestamp": 1829922075,
      "time": "2019-12-07T16:04:37Z",
      "channel": 0,
      "rssi": -42,
      "snr": 10,
      "rf_chain": 1,
      "latitude": 52.374485,
      "longitude": 4.635738,
      "location_source": "registry"
    }
  ]

I’m sure it’s really the same gateway. I don’t know if those details were ever different than today.

application data

gateway traffic

In case it helps: for a The Things Gateway I often, or always, only get the green icon in the gateway’s Traffic page. But for other gateways I’ve also seen the orange Join Request in their Traffic pages. In all occasions, OTAA does work fine, for me.

Hmmm, where/how did you capture the above? It’s weird to see location details outside of the gateways array? I’m not seeing that anywhere in TTN Console. (Also, given the time, I guess this has been captured before creating the screenshots?)

Inspecting the packet in the application data screen.

Yes, I first observed OTAA failing, then looked for this issue, than inspected app- and gateway-data and finaly made screenshots.

I’ve edited my 5:26 PM UTC post: on the application’s Data page the orange icon is actually an Activation event (like including the assigned DevAddr), not a Join Request uplink. Of course, those are very much related, but that might explain why its gateways array is less verbose: just a different path in the code somewhere?

Did you see the following?

This gateway is a IMST IC880a concentrator on a RPI3 with mp_pkt_fwd (Jac’s) over a 4G (forced, 3G is not allowed) backhaul.

The latency does not dot not explain the metadata that is missing I think.

On the contrary I have found that this gateway is suffering from desensing due some defect. This is under investigation.

Very true. But as for me the metadata seems incomplete as well (while for me the device joins just fine then), I wonder if the incomplete metadata is truly related. Also, both of us get the green Join Accept downlink in the gateway’s Traffic page, so TTN has selected the right gateway for that downlink.

Just in case you happen to be able to tell, now or in the future: do successful joins for that same gateway indeed (and always…?) show the gtw_id in the orange Activation event on the Data page? (The metadata might be different when looking at an orange Join Request on a gateway’s Traffic page, which might show for some gateways but not for others.)

And assuming you have some nice radio equipment to tell if the gateway is sending: is it close enough to measure if it is transmitting the downlink? Also, some gateways might log something like “too late” if TTN’s downlink command was received too late for transmission at the requested time.

I do keep on looking in to it with more and more sofisticated analysis tools. Thanks for thinking wth me on this topis.

Man, would it not be great to get support from TTN or to have acces to logging and gateway data. Sigh. We stay blind. Stumbling trough the dark.