Hi,
I’m facing an issue with one of my node (mclimate CO2).
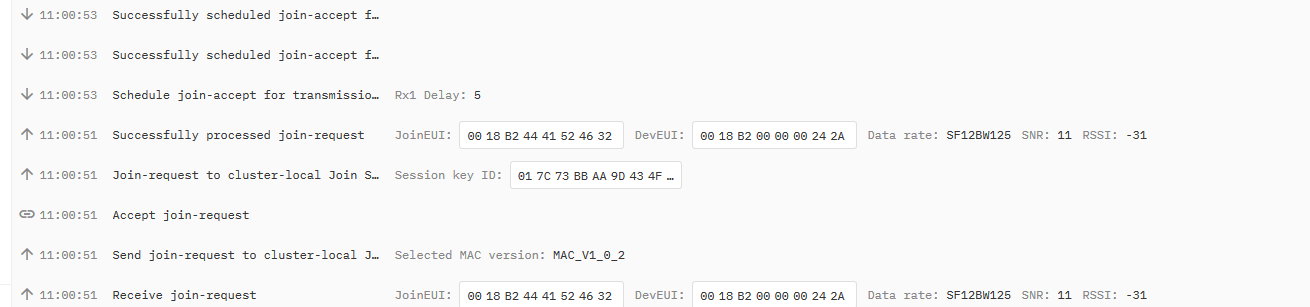
When node try to join, TTN accept join request, successfuly process it, but no dowlink “join-accept” is scheduled.
When I try to join with my Adeunis tester, I can see this downlink scheduling, but not when my device try to.
Adeunis tester:
My MClimate Node:
Node is maybe to far from gateway, but I don’t unserstand why I can not see any downlink after join accept
I’m facing a very similar issue
Join-requests from my multiple devices are received from the application through two public gateways in nearby, but Join-accept is never scheduled from application
I discovered that turning-on a third gateway (an indoor gateway we used during device development) the application receives join-requests from all three gateways (it discard two duplicate messages) and finally schedule a downlink Join-accept througt the third gateway we added.
Checking the differences on TTN events for all join-request received, I discovered the both public gateways didn’t insert thier ISO 8601 UTC timestamp (JSON property “time” inside “settings” and “gateway” objects). The ISO 8601 UTC timestamp is instead properly included on all uplink events coming from my gateway.
So I suppose that the TTN application isn’t able to select a gateway without ISO UTC time set for downlink scheduling.
During your tests, both Adenuis tester and MClimate Node are using tha same gateway?
Try to check JSON documents of join-request events on TTN console in order to verify if ISO UTC Time (“time”) is included on gateway(s) objects
That’s not needed. Only gateways with an optional GPS should be adding that.
So I suppose that the TTN application isn’t able to select a gateway without ISO UTC time set for downlink scheduling. Otherwise the time the gateway’s computer has unreliably convinced itself it is, is irrelevant for LoRaWAN purposes and really only taken into account in a situation where SSL certificate validation would check that the apparent current time is between the certificate’s creating and expiration dates.
Incorrect.
Normally downlinks are scheduled against the gateway’s unique and only self-relevant rolling 32 bit microsecond counter as reported in the uplink. The network server adds the appriate window delay in full seconds and sends the number back in the downlink command.
My Dragino LG308 Gateway uses NTP client to fetch absolute date&time form the network and includes it into uplink messages to ns/as
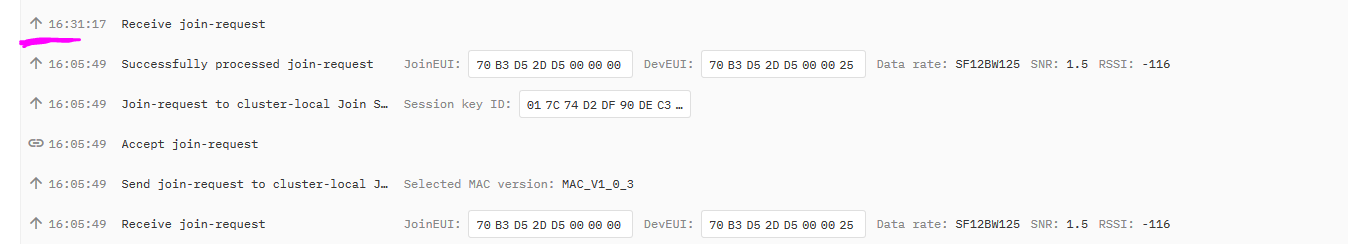
This is just my guess from observed behaviour. My application properly receive node Join-request from two different public gateways (fixed located to Milan est, not mine). The join-request is accepted and successfully processed by ns/as. The verbose console shows ‘Successfully processed join-request’ (event ‘ns.up.join.process’) as last event but no ‘Schedule join-accept for transmission on Gateway Server’ is generated (event ‘ns.down.join.schedule.attempt’).
Turning on my gateway (Dragino LG308) in the node range, I saw join-request from all three gateways, but in this case the ns/as properly generate ‘Schedule join-accept for transmission on Gateway Server’ and join process completes successfully.
The only difference in the join-request uplink messages from the three gateways is the missing “time” property on first two gateways, so I guess that gateways without “time” aren’t selected for downlink communications.
Is there some others that can inhibit gateway selection for downlink? RSSI and SNR are very good for both unselected gateways.
When join was obtained, I can switch off my gateway and uplink data still to be properly forwarded to my application using other gateways. But, now, if I try to send downlink command to my node (from application console or from my MQTT integration), downlink data never are scheduled to GatwayServer, but turning on again my working gateway, downlink messages are properly scheduled to the node through my gateway.
As the two gateways that don’t have some extra time info work, why not turn off NTP on the Dragino as a quick test. Maybe the time is just out enough (as NTP is connecting to an atomic clock over a connection with some element of latency) that it is being ruled out.
I already did this test. The “time” property is still present on Dragino uplink messages, also disabling its NTP client, but of course the date&time isn’t correct (it’s starting from 00:00:00 of 1/1/2012)
Also in this case downlink messages are scheduled and properly delivered to nodes.
Without Dragino gateway online downlink scheduling never happens (for Join-accept, ADR, uplink-confirms or downlink messages enqueued from application), despite uplink messages are properly forwarded to my application through the remaining two public gateways in range (id ‘eui-1dee1a0a6e94d4bf-n’ and ‘eui-1dee0c54134693cb-n’ both sending uplink data without “time” property)
Ok thanks, forget my guesses
Did you read carefully my issue report?
How do you can explain the observed behaviour?
It’s real, deterministic and repeatable, not a guess…
The issue happens using different devices and different TTN v3 applications, when only the two ‘bad’ gateways are used.
So it seems related to some issues on messages coming from such gateways (recentely migrated from ttn v2 to v3) that impact/reflects on network/application response (no join-response is scheduled)
Unfortunately we are running a trial on area covered by such ‘bad’ gateways and this impacts on our monitoring nodes. The trial is running since one year, and before gateways migration to ttn v3 this issue never happened
It would help if you could show full raw signal reports from both the working and non-working gateways for the same packet.
It would also be good to document the exact hardware and software configuration of each.
It would also be worth trying an ABP node, and seeing both if you can get application level uplinks reported in with only the “problem” gateways in the receive list, and if you can successfully send a downlink back.
The ‘bad’ gateways and our nodes are in est Milan now, 500 km far away from my office. So, now I cannot repeat ‘side-by-side tests’ using my gateway in order to get raw messages/events from TTN console for same packet on bad and good gateway at same time.
I used my Dragino gateway in Milan last Friday just to allow nodes successfully join to our application and then I left nodes working (only for uplink) using bad gateways in est Milan.
Nodes are sendind uplink data to application but ADR isn’t scheduled in downlink, so nodes progressively slow down to SF12 and donwlink messages enqueued from TTN console aren’t scheduled to nodes.
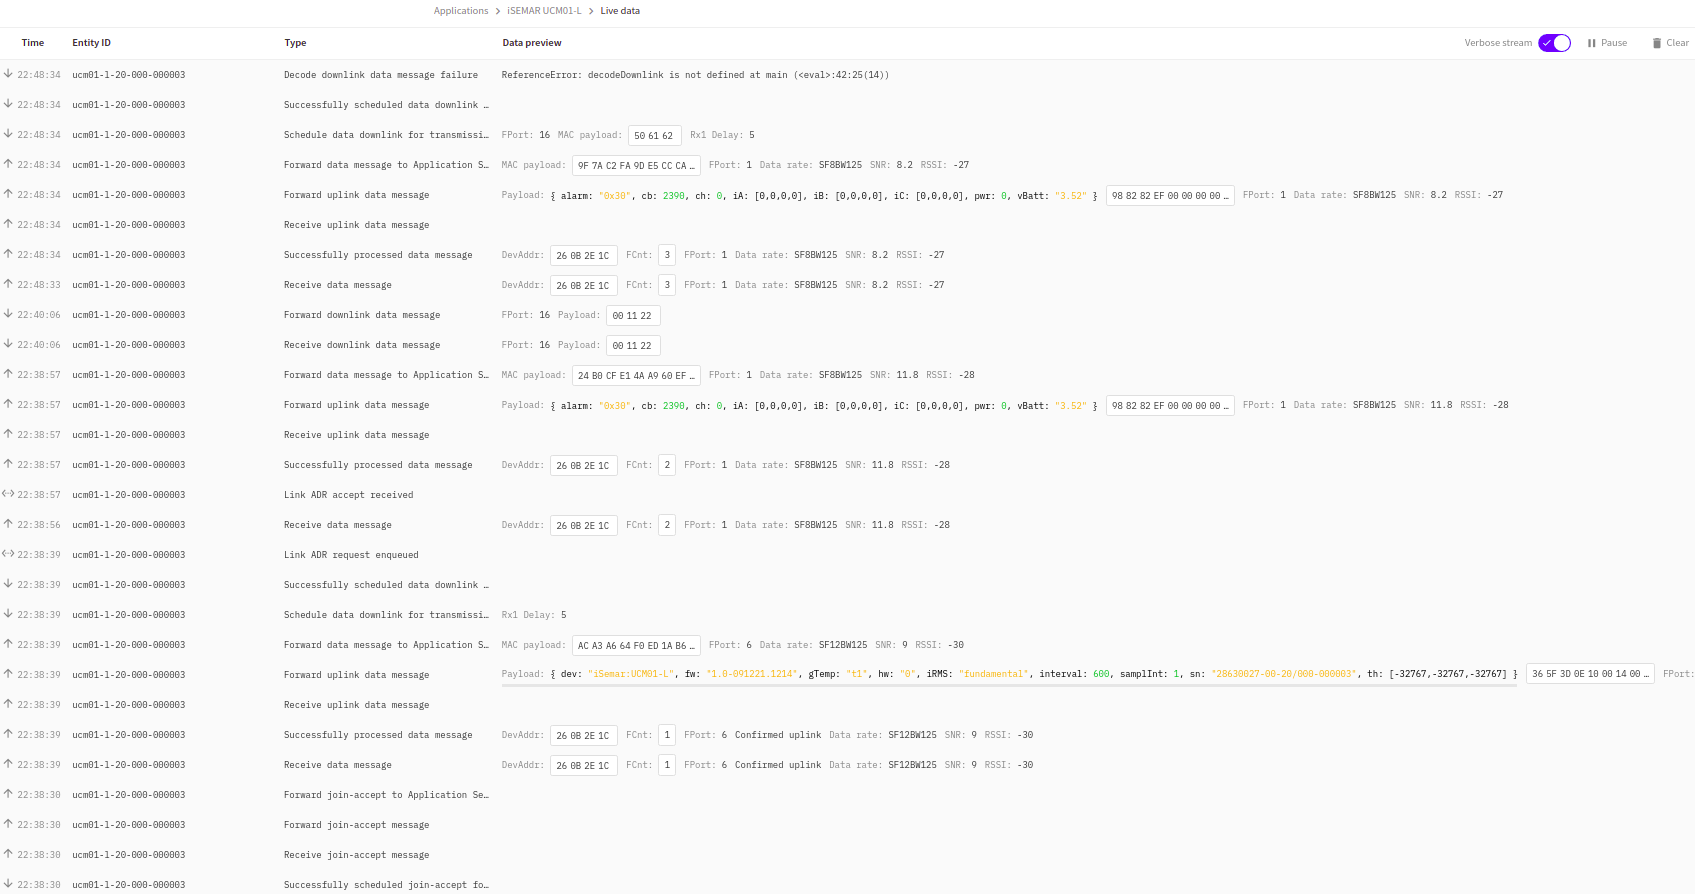
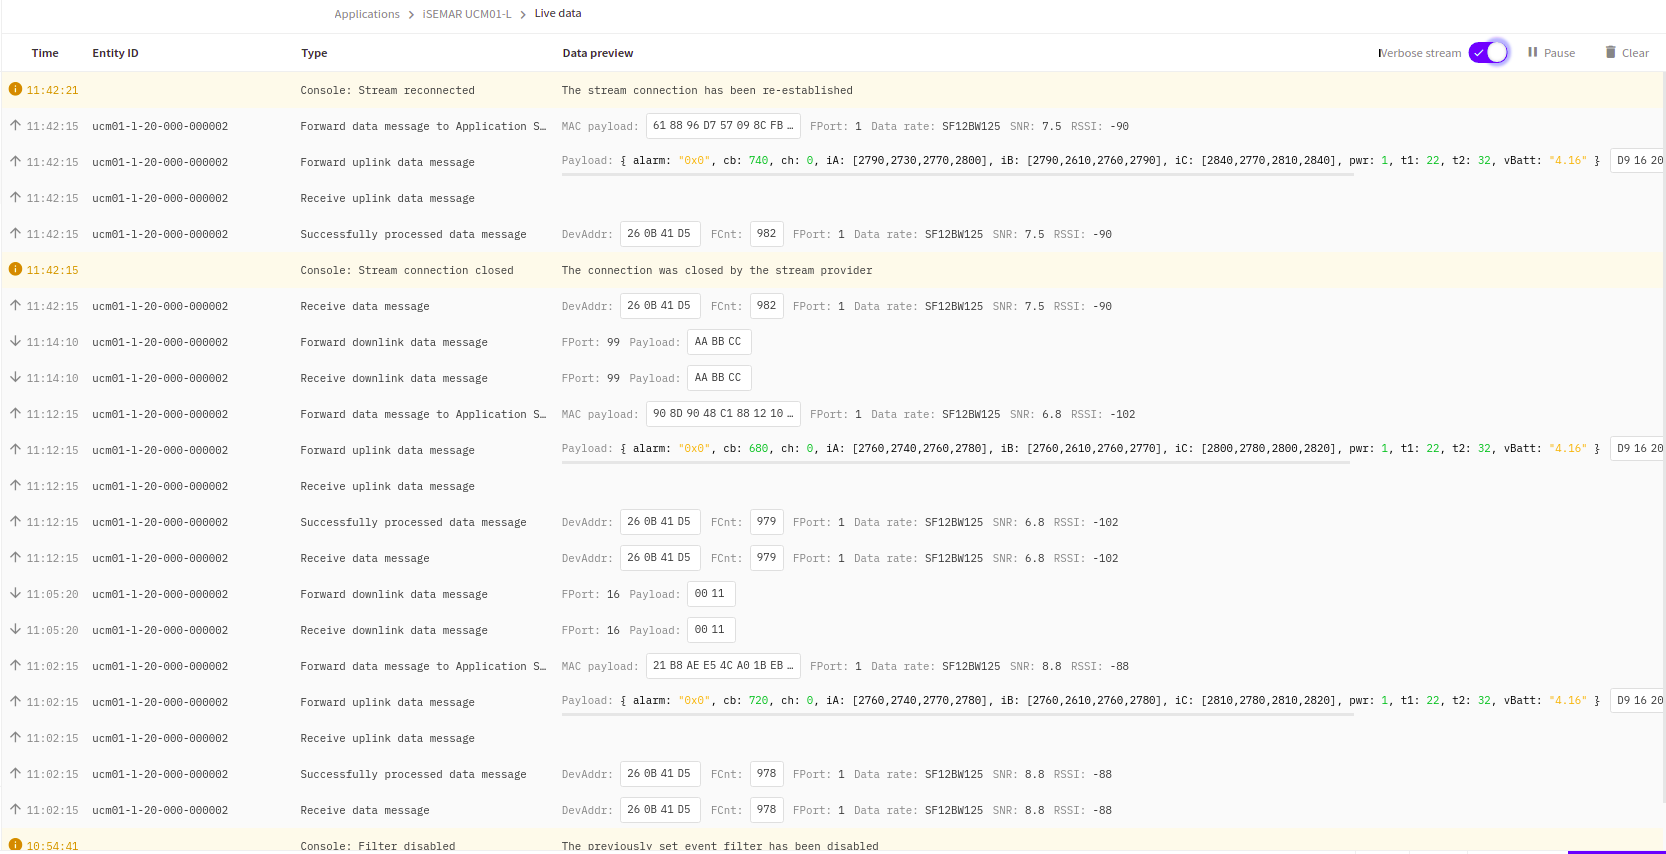
Attached you can find all TTN events (acquired from streaming on https://eu1.cloud.thethings.network/api/v3/events) related to two nodes (same model and configuration) sending uplink data to our application.
One node is in Milan and served by bad gateway, another is here in my office and served by good Dragino gateway.
A same time we also traced gateways events on TTN, both for good and bad gateway (I obtained an API key from bad gateway administrator with grants to log gateway events).
All traces are attached as JSON documents.
I traced some uplink messages from both nodes/gateways with a couple of downlink messages enqueued from TTN console while waiting for next uplink from nodes.
As you can see in the traces, downlink messages are scheduled only for node served by good gateway. On node served by bad gateway downlink messages are received/forwarded from AS but never scheduled/sent to node on rx window(s) of next uplinks
On below some data to properly understand traces
Bad gateway side (Milan)
gateway: id eui-1dee1a0a6e94d4bf-n
node: id ucm01-l-20-000-000002 , devAddr 260B41D5 , devEUI E24F43FFFE44BB65
Good gateway side (Ancona)
gateway: id eui-a840411d04504150
node: id ucm01-l-20-000-000003 , devAddr 260B2E1C , devEUI E24F43FFFE44BB5C
Hope someone can help us to understand the origin of this issue