Hi
I have a Heltec V2.1 board that i have tried various examples using the LMIC library (Latest version) with the same result. This is test device so key exposure is a non issue.
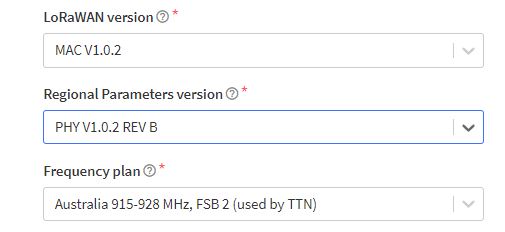
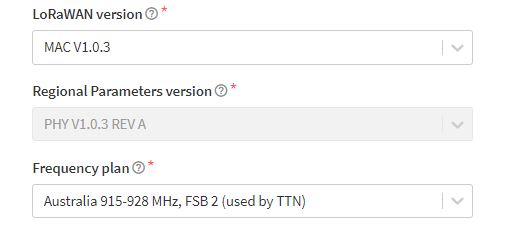
The first uplink is ok and the payload decoded correctly and counter is 1 (I am using One example to rule them all) Device is setup for AU915.
After the first uplink this happens and repeats what looks like every 5 seconds or so
any pointers ideas are most welcome ![]()
Device-id: wifi-lora-32-v2
LMIC library: MCCI
Activation: OTAA
Interval: 60 seconds000000022160: Event: EV_JOINING
000000022253: Event: EV_TXSTART000000022338: doWork job started
000000363279: Event: EV_JOINED
Network Id: 19
Device Address: 260DFB03
Application Session Key: EC-BC-6E-DB-EB-F5-3C-21-4B-88-61-1D-46-03-0A-76
Network Session Key: ED-E6-1D-FD-10-09-58-4C-63-09-18-51-2D-14-5F-78000000364170: doWork job started
000000367495: Input data collected
COUNTER value: 1
000000367529: Packet queued
000000367605: Event: EV_TXSTART
000000706716: Event: EV_TXCOMPLETE
Up: 1, Down: 1
Downlink received
RSSI: -69 dBm, SNR: 6.7 dB
Port: 0
000000737358: Event: EV_TXSTART
000001076452: Event: EV_TXCOMPLETE
Up: 2, Down: 2
Downlink received
RSSI: -70 dBm, SNR: 6.5 dB
Port: 0
000001107092: Event: EV_TXSTART
000001446189: Event: EV_TXCOMPLETE
Up: 3, Down: 3
Downlink received
RSSI: -69 dBm, SNR: 6.7 dB
Port: 0
000001476829: Event: EV_TXSTART
000001815924: Event: EV_TXCOMPLETE
Up: 4, Down: 4
Downlink received
RSSI: -74 dBm, SNR: 3.0 dB
Port: 0
000001846565: Event: EV_TXSTART
000002185660: Event: EV_TXCOMPLETE
Up: 5, Down: 5
Downlink received
RSSI: -72 dBm, SNR: 5.0 dB
Port: 0
000002216301: Event: EV_TXSTART
000002555396: Event: EV_TXCOMPLETE
Up: 6, Down: 6
Downlink received
RSSI: -69 dBm, SNR: 6.5 dB
Port: 0
and from the TTN console
22:20:30 Link ADR request enqueued
22:20:30 Link ADR request enqueued
22:20:30 Successfully scheduled data downlink for transmission on Gateway Server
22:20:30 Schedule data downlink for transmission on Gateway Server Rx1 Delay 5
22:20:30 Forward data message to Application Server Data rate SF10BW125 SNR 11.8 RSSI -58
22:20:30 Store upstream data message
22:20:30 Forward uplink data message Payload Data rate SF10BW125 SNR 11.8 RSSI-58
22:20:30 Decode uplink data message warning Payload Data rate SF10BW125 SNR 11.8 RSSI-58
22:20:30 Receive uplink data message
22:20:30 Successfully processed data message DevAddr 260D0739 FCnt 2 Data rate SF10BW125 SNR 11.8 RSSI-58
22:20:30 Link ADR rejection received
22:20:30 Receive data message DevAddr 260D0739 FCnt 2 Data rate SF10BW125 SNR 11.8 RSSI-58
22:20:25 Link ADR request enqueued
22:20:25 Link ADR request enqueued
22:20:25 Successfully scheduled data downlink for transmission on Gateway Server
22:20:25 Schedule data downlink for transmission on Gateway Server Rx1 Delay 5
22:20:24 Forward data message to Application Server  Data rate SF10BW125 SNR 11.2 RSSI-58
22:20:24 Store upstream data message
22:20:24 Forward uplink data message Payload Data rate SF10BW125 SNR 11.2 RSSI-58
22:20:24 Decode uplink data message warning Payload Data rate SF10BW125 SNR 11.2 RSSI-58
22:20:24 Receive uplink data message
22:20:24 Successfully processed data message DevAddr 260D0739 FCnt 1 Data rate SF10BW125 SNR 11.2 RSSI-58
22:20:24 Link ADR rejection received
22:20:24 Receive data message DevAddr 260D0739 FCnt 1 Data rate SF10BW125 SNR 11.2 RSSI-58
22:20:19 Forward data message to Application Server MAC payload 83C9 FPort 10 Data rate SF10BW125 SNR 10 RSSI-60
22:20:19 Store upstream data message
22:20:19 Forward uplink data message Payload counter1 0001 FPort 10 Data rate SF10BW125 SNR 10 RSSI-60
22:20:19 Link ADR request enqueued
22:20:19 Link ADR request enqueued
22:20:19 Successfully scheduled data downlink for transmission on Gateway Server
22:20:19 Schedule data downlink for transmission on Gateway Server Rx1 Delay 5
22:20:18 Receive uplink data message
22:20:18 Successfully processed data message DevAddr 260D0739 FPort 10 Data rate SF10BW125 SNR 10 RSSI-60
22:20:18 Receive data message DevAddr 260D0739 FPort 10 Data rate SF10BW125 SNR 10 RSSI-60
22:20:15 Forward join-accept to Application Server
22:20:15 Forward join-accept message
22:20:15 Receive join-accept message
22:20:15 Successfully scheduled join-accept for transmission on Gateway Server
22:20:15 Schedule join-accept for transmission on Gateway Server Rx1 Delay 5
22:20:13 Successfully processed join-request JoinEUI 862A4C214DC9F222 DevEUI 70B3D57ED0044260 Data rate SF10BW125 SNR 10.2 RSSI-55
22:20:13 Join-request to cluster-local Join Server succeeded Session key ID 017B58C6904C9823…
22:20:13 Accept join-request
22:20:13 Send join-request to cluster-local Join Server Selected MAC version MAC_V1_0_2
22:20:13 Receive join-request JoinEUI 862A4C214DC9F222 DevEUI 70B3D57ED0044260 Data rate SF10BW125 SNR 10.2 RSSI-55
22:20:12 Successfully processed join-request JoinEUI 862A4C214DC9F222 DevEUI 70B3D57ED0044260 Data rate SF10BW125 SNR 11 RSSI-55
22:20:12 Join-request to cluster-local Join Server succeeded Session key ID 017B58C68E4483DC…
22:20:12 Accept join-request
22:20:12 Send join-request to cluster-local Join Server Selected MAC version MAC_V1_0_2
22:20:12 Receive join-request JoinEUI 862A4C214DC9F222 DevEUI 70B3D57ED0044260 Data rate SF10BW125 SNR 11 RSSI-55
Regards
Jman