I have some ancient ABP devices running (since 2019 using RFM95). In the last months the traffic of 2 of these ABP devices is no longer appearing in the TTN console.
However I do see the traffic being send in the GW logs. Also when I configure these devices on my stand alone gateway the data is received correct.
Does anybody else have similar experience? (and maybe a solution :-))
FC (UL) was around 58.000 (so no overflow for the 16 bit counter). Yes I did reboot the device but FC is stored (also configured at TTN that FrameCounter is not checked).
That doesn’t not help with the MIC calculations as that uses the full 32 bits of the expected value (at least ttn by default does). However if your counter is still below 64k it doesn’t matter.
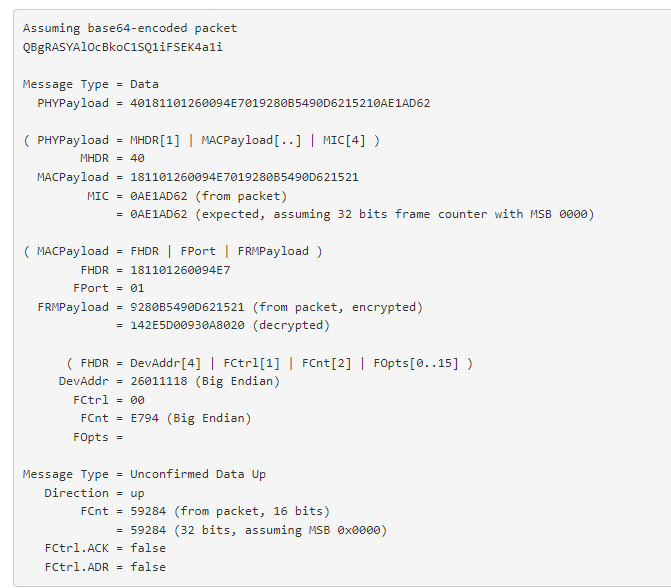
Can you try to decode and validate the uplink as seen in the gateway part of TTN console using the packet decoder?
Well, some of these devices have been running for over 4 years without any problem. Suddenly traffic does not show up at TTN while other standalone gw continues to receives ABP from this device.
Just made a fresh TTN ABP device configuration and hooked up device with similar hardware / software. Works like a charm.
My bet is still that something in the routing is mixed up (btw → stack was Ideetron’s).
Does that handle MAC commands? If not you are probably dos-sing the gateway. Check the number of downlinks for the device in the console to see if there are (almost) as many as uplinks.
For various values of not at all, at least not from the public repro.
As ever, would be easier to answer if we had an answer to what the device / MCU was as there are variations. And more details in the various statements:
Works like a charm with what? The standalone gateway or TTN?
What is the standalone gateway and how old is its firmware - if they are of the same vintage they will most likely be compatible.
Whereas TTSv3 is aiming for compliance so has expectations these days.
Given more info we can probably help as there are things that can be set on the console, but at about post 20 interest wanes in soliciting more info
As mentioned: “fresh TTN ABP device configuration”. So running “like a charm” on TTN network. Of course also verified (positive) via the Stand Alone GW (running ChirpStack - installed sw version early 2022).
Funny thing is that the device, from which I do not see the traffic in the TTN console, is sending LoRa packets that can be decoded via TTN online decoder (see link from Jac above) and on the StandAlone Gateway.
Only solution which could work for now is to route the GW traffic to my our LoRa BE server and decode it there. However I am curious why it suddenly stops working, will try to collect some more details this week and post results here
As a test I created 2 “fresh & identical devices” on my TTN account yesterday evening. Of the 2 devices I see all traffic on the gateways (once per hour). However when looking at the device level (TTN console inside the application):
Device 1: All messages appear in the TTN console.
Device 2: Most of the messages are not showing up in the TTN console. Message send every hour and last message I saw was 02:30. (while the last message on the gateway was approx. 08:00)