I, probably like other folk, have a simple MQTT task monitoring a regular SF7 heartbeat from a relatively local fixed node against my gateway of interest. In the event the gateway goes off-air my task can simply notify me and I can investigate.
It occured to me that during a period of tropospheric propagation, the array of “gateways”:[{“gtw_id”:“my gateway”, …},{“gtw_id”:“another unexpected gateway”, …}] returned via MQTT may very occasionally include additional gateway(s), due to the bouncing of the fixed node signal propagating beyond the normal line-of-sight.
While it obviously makes sense to minimise the transmission power of any such monitoring node (in fact, in my case I even have it fed into a dummy load rather than antenna!) it is not inconceivable that another gateway could hear the signal when conditions permit.
Has anyone in the community considered mapping tropospheric alerts by MQTT by simply spotting increased number of gateway responses?
Information about tropospheric events is always useful for other radio users, such as Hams and people monitoring aircraft ADS-B. In the case of the latter, aircraft broadcasts are occasionally received over the radio horizon and/or lower than expected elevation angles.
Radio Hams may monitor beacons on specific frequencies and notice when the RSSI creeps up above the noise, indicating lift conditions.
It seems to me that responses from heartbeat style monitoring of LoRaWAN gateways could double-up as a way of detecting unusual propagation, which may be of interest to some people, especially if the observation can be shared across a region.
Like many other LoRa networkers, we observe quite unlikely long links, well beyond what earth curvature permits, during times of tropospheric ducting and/or bending.
We havent gotten round to analysing this more systematically (but we hope to, soon, in the (extended) nordic countries) -
but colleagues at the ICTP Trieste have done more systematic work - check here: https://arxiv.org/abs/2004.02802 - basically a network of probes on TTN to detect and analyze unusual long shots.
I believe they d also be happy for more people to volunteer data and set up probes.
( @marcozennaro might be listening in!)
So, there is some research into that field, and if you (and others) find that interesting, make sure to get in touch!
Thanks @sebastianb that is very encouraging.
I’m more than happy to share my data. I see occasional ducting on 1090Mhz, especially during periods of high atmospheric pressure and its useful to know that I can expect something similar at 968 Mhz. I’ll refine my MQTT monitor to alert on such events.
It would be great to analyze some of your links, @hphillip. We have developed some python tools to analyze such long links by correlating them to radiosonde data. You can find them here: https://github.com/marcorainone/TropPOLoRaTools We are finalizing a paper where we explain how to use them
Please feel free to get in touch: mzennaro@ictp.it
Thank you very much for your responses. Great to hear that people are already monitoring propagation distances.
It is early days for me with LoRa and very much a hobby project and I am learning as I go.
One thing that is evident with Tropospheric Ducting (certainly for ADS-B signals on 1090MHz for which I am more familiar) is that not only do signals travel further than the usual radio horizon but the bouncing of the signal can make transmitters that are normally in shadow suddenly appear.
So what I have done previously is calculate the elevation angle between gateway and node, by trusting the altitude above sea level, latitude and longitude.
Over time I build up typical maximum distance for each bearing and this correlates closely with web sites like heywhatsthat under “flat” conditions.
As soon as I see calculated elevation angles going substantially more negative than my standard picture I can be pretty sure the current tropospheric condition is having an impact.
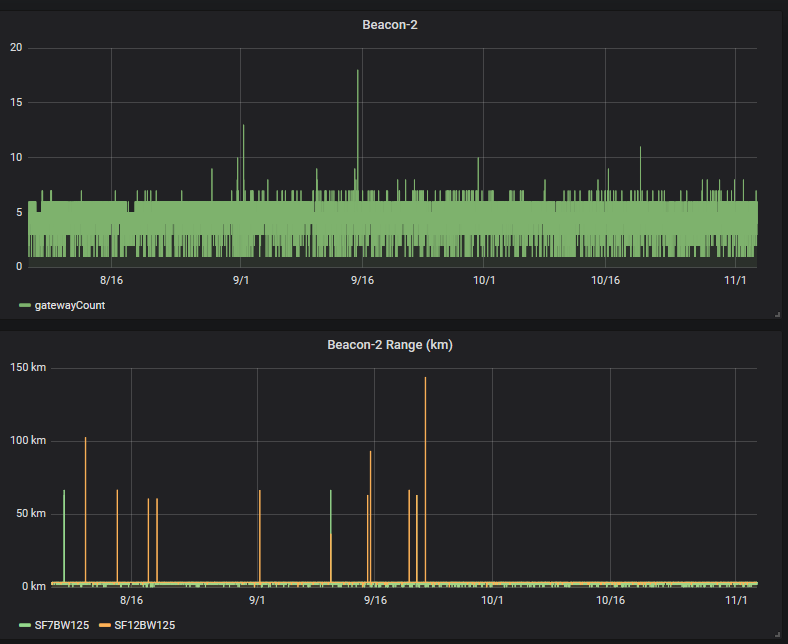
@pe1mew I do like your graph of the last 90 days. Great idea. @marcozennaro I will certainly look with interest when you finalize you paper on the TropPOLoRaTools