I am asking for help as I am encountering a strange behaviour with my things indoor gateway.
I am working on a project where I would like my sensors to send information once a day to my gateway, and to get confirmation that the message has been received. My testing where doing fine, but suddenly yesterday confirmations for my uplinks stopped appearing in my gateway traffic console. I was correctly seeing them before (no capture, sorry… Didn’t see it coming) but now all I see is the following :
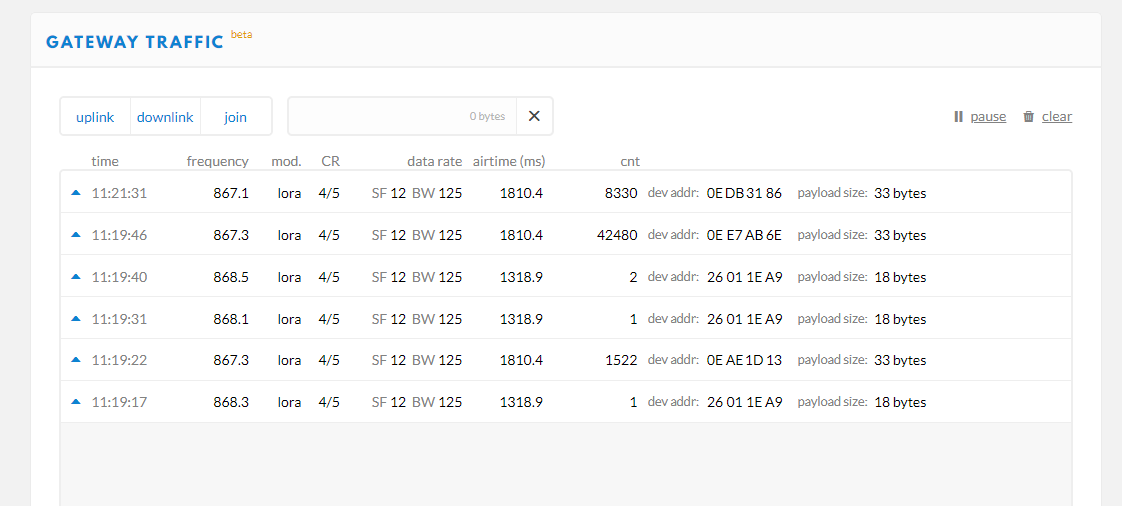
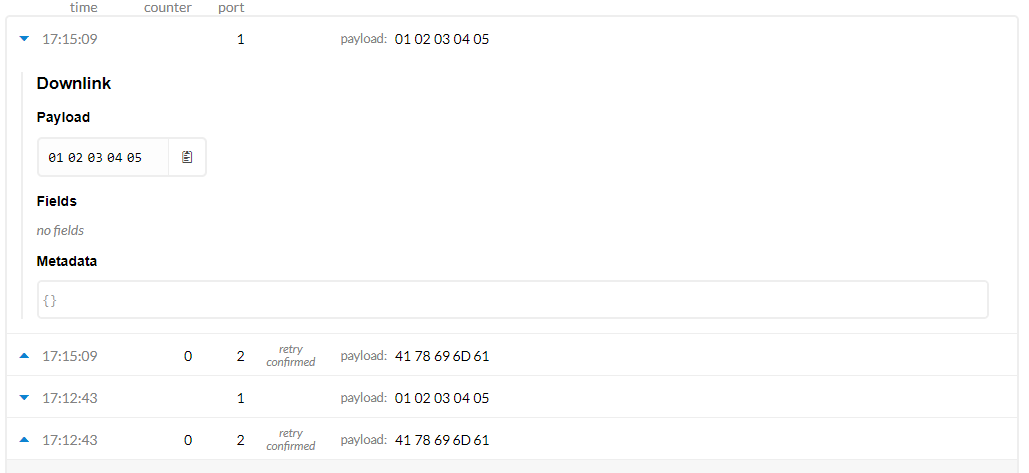
(my device is the one with devaddr = 26 01 1E A9, sending confirmed uplinks)
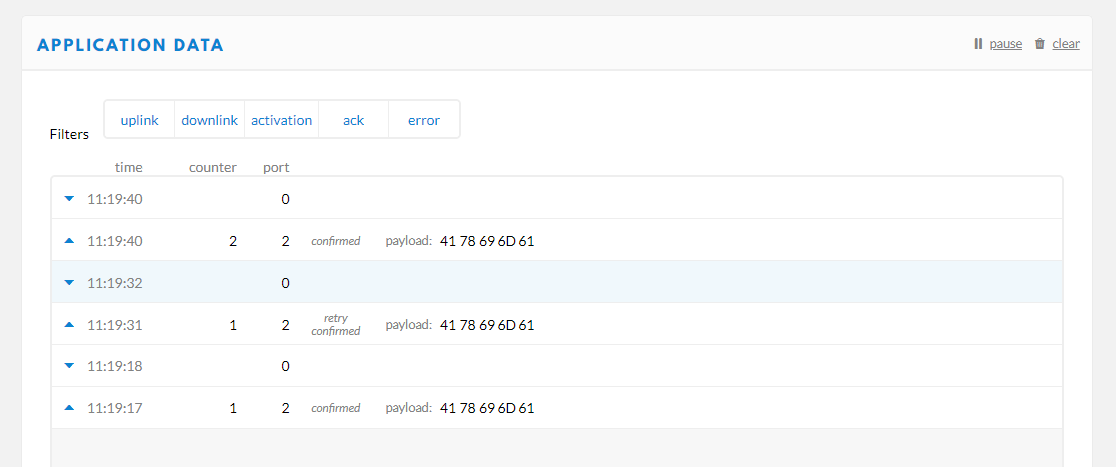
here is my application data for the sensor: (if it helps…)
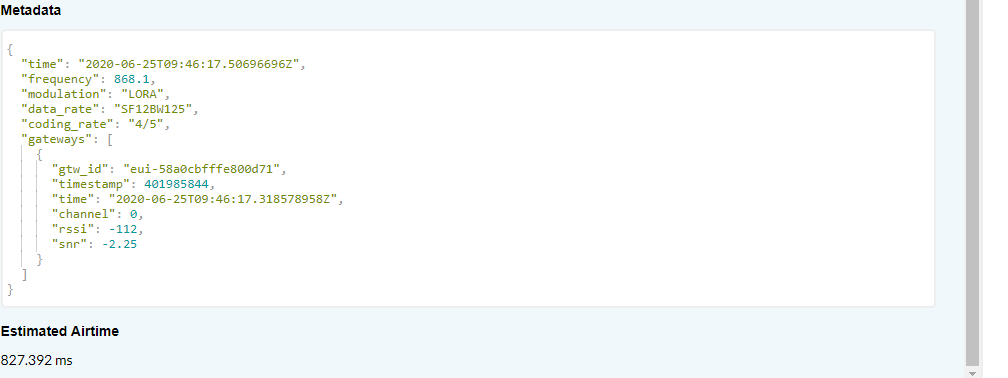
And here is one of the uplink (decoded) received by the gateway :
No other gateway is in range. My gateway is the only one receiving the uplink message.
I have tried to disable ADR, resetting my sensor, my gateway… But nothing helped. Any help is welcomed! I am a beginner with this kind of technology, I’m sorry if the solution seems obvious to you.
Did you confirm by clicking an uplink in the application/device’s Data page, to see what is in the metadata?
Aside, assuming you’re quite close to your own gateway: using SF12BW125 seems like a lot of overkill. That is the worst available data rate, using about 50 times as much airtime as SF7BW125.
Are all uplinks repeated (so: does the device indeed not receive an ACK for all its confirmed uplinks)? And are all repeated the same number of times? Does clicking an uplink in the gateway’s Traffic page tell you anything?
Seeing only a single retry in the screenshot above could indicate that the retry actually worked, so: that the downlink was actually transmitted and received? The gateway’s Traffic data in TTN Console is just very unreliable. I’ve not seen it before, but maybe it sometimes shows the uplinks but not the downlinks, while they were actually delegated to the gateway just fine. If only some uplinks need a retry, then that could indicate much different issues.
(Aside: don’t ignore my remark about SF12. As shown in your screenshot, that needs almost a full second to transmit the data!)
All uplinks are repeated twice, according to my settings, so it seems that no ack are received. I must say that even when my GW was sending downlinks (at least, the console was showing it) my node were repeating all uplinks twice, and I was working on fixing that on my project.
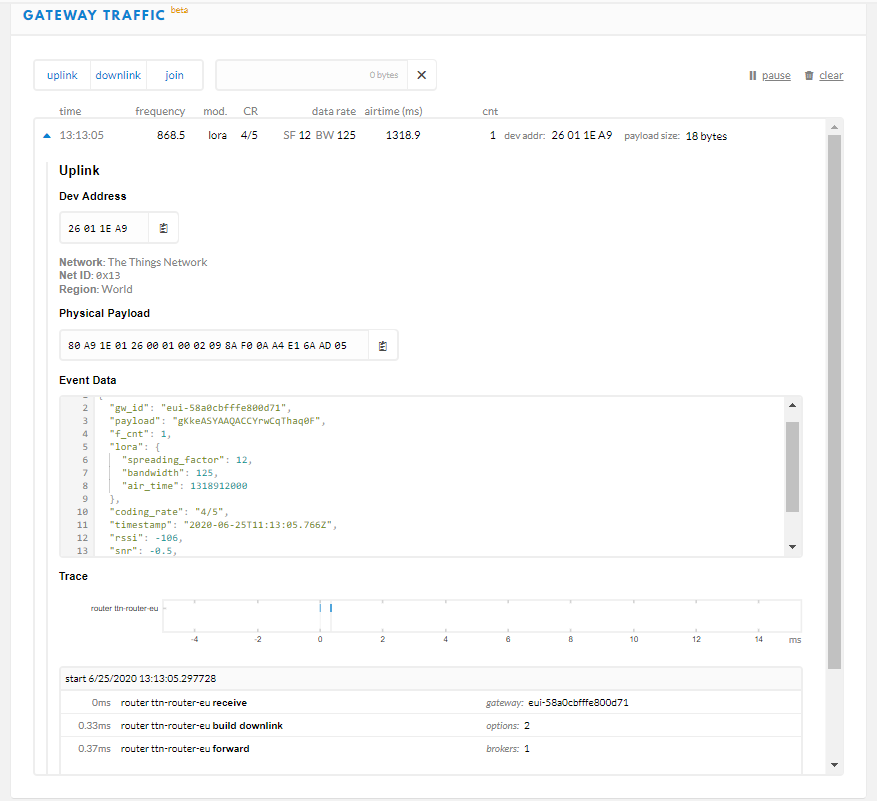
Clicking on an uplink doesn’t help a lot from my opinion, but here is it :
I tried many time in the last 24h, like 100 times or so, so it is not something occuring “sometimes” but at least nearly always.
Aside : I am not ignoring your remark, and will configure my node accordingly as soon as I am done eating
You’re right. Most details are in the downlink, in the gateway Traffic, but that’s the one you do not even see…
What if you schedule a dummy application downlink? (That’s in the device’s Overview page in TTN Console.) If that shows as expected, then ACKs for confirmed uplinks might be broken.
Also, subscribing to the MQTT Data API might show more. Use the -v flag to include the topic in the output, and use double-quotes on Windows, like:
If things are suddenly fixed when no longer using SF12, then I guess it’s related to your device not adhering to ADR commands that TTN has sent earlier (which it very likely has tried, as the network does not like SF12/DR0 either), which will make TTN stop sending ADR commands. That, of course, should not stop all downlinks, but who knows…
Am I right to assume this is ABP? If yes: did you set the correct EU868 RX2 parameters?
I tried it just now, but nothing appears on the gateway traffic.
My node is now emitting using SF7, and is showing accordingly in GW traffic, but still no downlink.
This is indeed ABP, and i set RX2 parameters with 869.525 MHz and SF 9, as requested by the documentation I found.
For the MQTT Data API thing, I have to install things on my computer if I understood correctly, and I cannot do that, as I am working on a locked companie computer…
I doubt that the TTN network would be aware of such gateway failure. It seems TTN is not even delegating the downlinks to your gateway.
Do you only have a single device? Maybe delete that in TTN Console and add it again using the same DevAddr, AppSKey and NwkSKey? Oh, bummer, that needs the ttnctl command line interface to force using the existing DevAddr… (Or needs you to reprogram the device as well.)
At least something good comes out of this then: this should convince someone that you should be able to use more than just Windows Notepad and Clock.
The metadata shows that the uplinks are only received by the TTIG.
The TTIG’s Traffic page in TTN Console shows the confirmed uplinks, but since yesterday is no longer showing the network ACK/confirmation downlinks, nor application downlinks.
The application’s Data page shows the uplinks too, so TTN clearly accepts the uplinks. (So: no frame counter security problems.)
The Data page also shows downlinks, which I assume are the ACKs. However, even though on port 0 (so: even though those are not application downlinks) I wonder if the application/device should even know about those, as an ACK is really a network thing? I assume this part works as expected though.
We cannot be sure if the downlinks are really not delegated to the TTIG, as it seems the node did not receive/handle the ACKs before this problem started either. (It already kept repeating the confirmed uplink when the ACK downlinks were still shown in TTN Console before yesterday.)
In the gateway’s Overview page in TTN Console, does the counter for “Transmitted Messages” change?
Though I doubt the problem is with the TTIG, and just in case it helps others debug: what’s the TTIG’s firmware version? What did you select for the gateway’s router and the application’s handler? Likely unrelated: am I right to assume you disabled the device’s frame counter security?
If at all possible, I would try to handle regular application downlinks in your device. Maybe your LoRaWAN stack is just not handling ACKs correctly…? What LoRaWAN stack are you using? Anything that can validate that the TTIG is indeed not being told to transmit the downlink…
My Application Data now shows the downlinks I simulated way earlier replacing the “normal” downlinks with no payload I usually see after an uplink. Is this supposed to happen?
Nothing changed in the GW traffic though, still no downlink.
Yes, that is normal. Well, except for the delay. Maybe you scheduled multiple downlinks? Then those will have been queued, and for each uplink one downlink would/should have been sent off to the gateway. TTN will then still add the ACK bit to confirm the last uplink to such application downlink.
(Aside: it’s not simulation but actual scheduling/queueing.)
I don’t have much to add @arjanvanb’s comprehensive answer.
The Data page also shows downlinks, which I assume are the ACKs. However, even though on port 0 (so: even though those are not application downlinks) I wonder if the application/device should even know about those, as an ACK is really a network thing? I assume this part works as expected though.
Yes indeed. This is Network layer only.
@Maxima: I think indeed MQTT is the best way to debug this. You don’t need to install anything locally. You can use this online MQTT client for testing MQTT Websocket Client.
I can try any thing you think could help, but I have to confess I don’t know how to use a MQTT client. I am still trying to figure out why i do not get my downlinks, and if I must I will do what Arjan adviced me, but from my personal computer at home. This way I would not be blocked by my companie internet policy.
Anyway, I can try using the online MQTT client, but I don’t know how to use it…
Is there any way I could “reset” my gateway on TTN? I mean, I reset it manually, but TTN still show me the total of messages received, transmitted etc, even the ones before the reset, so I didn’t clean TTN’s memory about my gateway, and I have the feeling that it may help. Is that stupid?
Aside: don’t focus too much on what you see the gateway Traffic in TTN Console. It’s just very unreliable. Like I wrote earlier: try to ensure your device is indeed not receiving the downlinks.