It is configured with correct settings. Port up/down is 1700 and server is router.eu.thethings.network. When I run ./lora_pkt_fwd it does not show downlink json packets. Only uplink is working. I tested it with sending downlink messages through TTN console and sending uplink test messages from node. Both messages are visible in TTN console.
I temporarily configured it to work with resiot.io service and it is working for both ways. So problem is with TTN. I don’t know anymore where to continue searching. Any ideas?
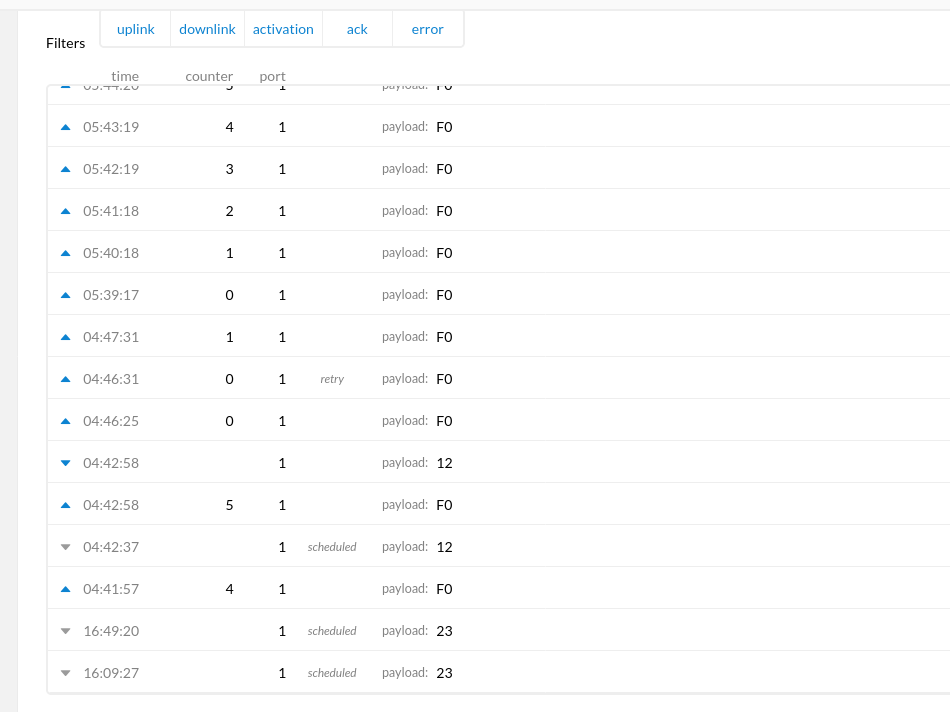
TTN gateway console shows only uplink messages. There is also one not-real downlink message. It has wrong frequency and SF for real downlink. I think it is there because that console is still in beta phase. But I might be wrong, who knows. My node is listening frequency 869.525MHz with SF9BW125. It is correct according to that document: https://www.thethingsnetwork.org/docs/lorawan/frequency-plans.html#eu863-870
Edit: Sorry, I misread that document. All uplink frequencies are also downlink frequencies. But that only partly explains this problem. Still only one downlink message from many tries have passed down.
While maybe indeed more downlinks should be shown, it seems you’ve disabled the uplink counter security check? That’s troublesome, as your node might not be expecting downlink counter 7 after it has been reset. (Ah, that’s not relevant, as the downlink counter that TTN uses will then be larger than the zero in the node, so accepted just fine unless the gap gets to be too big.)
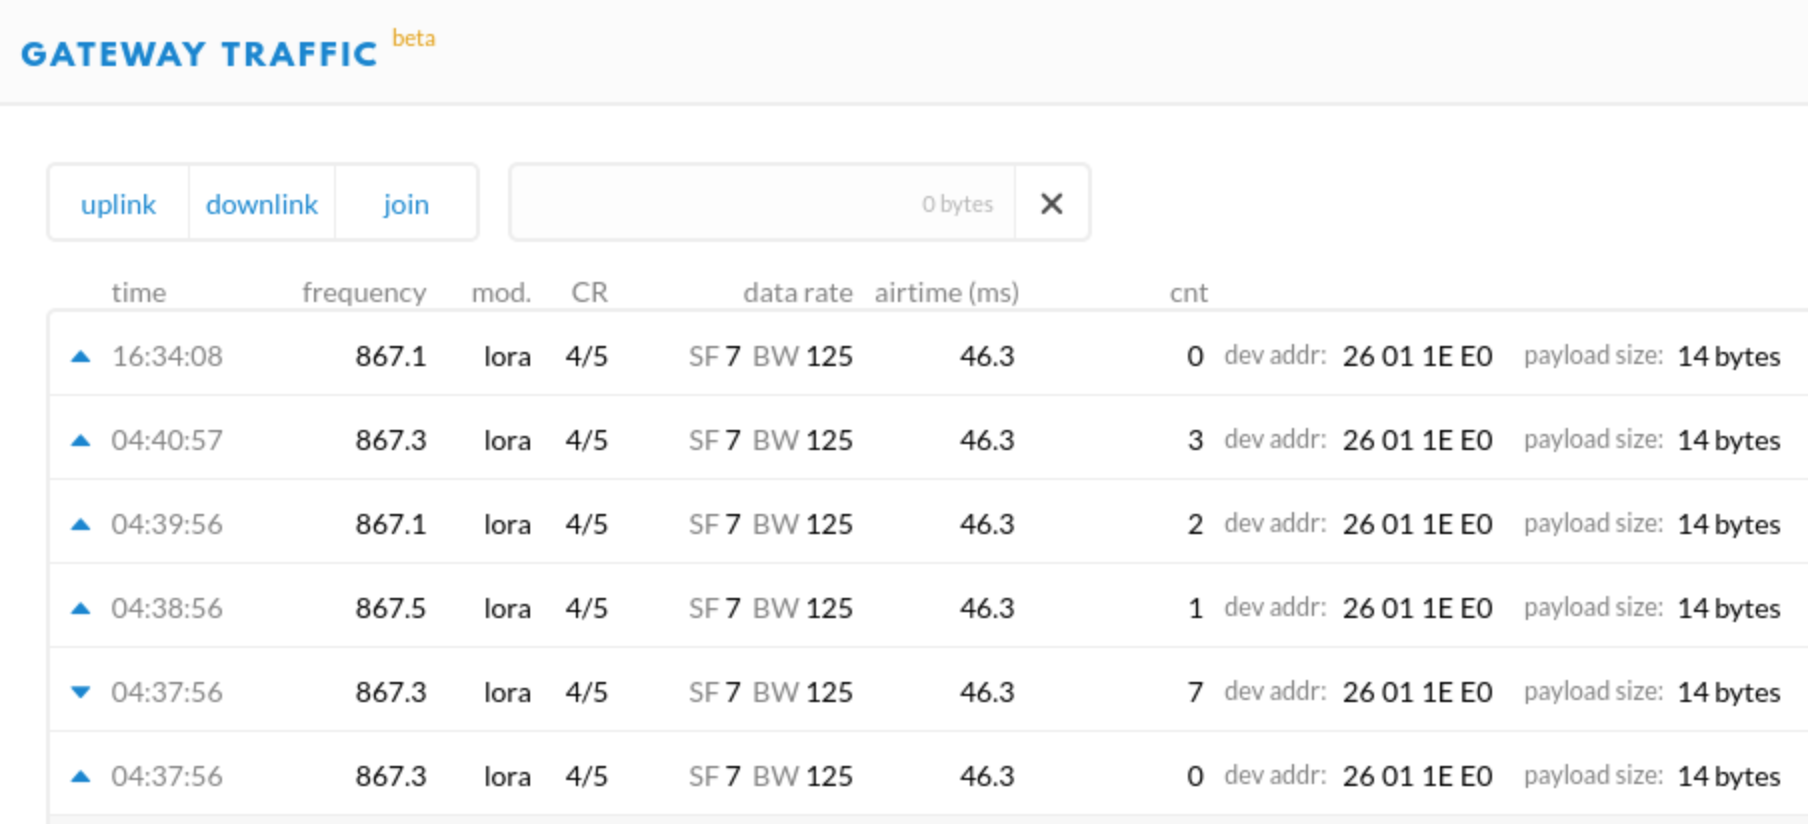
How’s the device configured? (ABP? Security disabled?) And are you sure downlinks are expected? A screenshot of both the device’s Data page, and the gateway’s Traffic page, taken at about the same time so for the same packets, might help make things clear. Also, clicking on uplinks/downlinks might reveal more details.
Also: you understand that downlinks will only be sent as a response to an uplink? (The TTN community network only supports Class A devices.)
I have a similar problem, downlink is not working as expected. Even if the TTN console shows that the downlink message is sent it is not received by the node.
I noticed for some time ago that sometimes it took forever to join with OTTA. The problem got worse with time and I suspected that my GW or my node was responsible for the problem. After I switched to ABP I noticed that messages was not always received by the node, today less than 1 of 20 messages are received.
For now I have tested with two GW:s and two nodes, one node based on RAK811 and one based on RN2483. They are all behaving in the same way, sometimes but very seldom are messages received by the node.
As I wrote, everything seems ok from the TTN-console. Messages are scheduled as expected and also transmitted according to the console.
The var/log/syslog file from the GW:
Click to see the full logs
Dec 18 15:55:31 rak-gateway ttn-gateway[1339]: # PUSH_DATA acknowledged: 100.00%
Dec 18 15:55:31 rak-gateway ttn-gateway[1339]: ### [DOWNSTREAM] ###
Dec 18 15:55:31 rak-gateway ttn-gateway[1339]: # PULL_DATA sent: 3 (100.00% acknowledged)
Dec 18 15:55:31 rak-gateway ttn-gateway[1339]: # PULL_RESP(onse) datagrams received: 0 (0 bytes)
Dec 18 15:55:31 rak-gateway ttn-gateway[1339]: # RF packets sent to concentrator: 0 (0 bytes)
Dec 18 15:55:31 rak-gateway ttn-gateway[1339]: # TX errors: 0
Dec 18 15:55:31 rak-gateway ttn-gateway[1339]: # TX rejected (collision packet): 0.00% (req:2, rej:0)
Dec 18 15:55:31 rak-gateway ttn-gateway[1339]: # TX rejected (collision beacon): 0.00% (req:2, rej:0)
Dec 18 15:55:31 rak-gateway ttn-gateway[1339]: # TX rejected (too late): 0.00% (req:2, rej:0)
Dec 18 15:55:31 rak-gateway ttn-gateway[1339]: # TX rejected (too early): 0.00% (req:2, rej:0)
Dec 18 15:55:31 rak-gateway ttn-gateway[1339]: # BEACON queued: 0
Dec 18 15:55:31 rak-gateway ttn-gateway[1339]: # BEACON sent so far: 0
Dec 18 15:55:31 rak-gateway ttn-gateway[1339]: # BEACON rejected: 0
Dec 18 15:55:31 rak-gateway ttn-gateway[1339]: ### [JIT] ###
Dec 18 15:55:31 rak-gateway ttn-gateway[1339]: # SX1301 time (PPS): 2102683136
Dec 18 15:55:31 rak-gateway ttn-gateway[1339]: src/jitqueue.c:448:jit_print_queue(): INFO: [jit] queue is empty
Dec 18 15:55:31 rak-gateway ttn-gateway[1339]: ### [GPS] ###
Dec 18 15:55:31 rak-gateway ttn-gateway[1339]: # Invalid time reference (age: 1576684445 sec)
Dec 18 15:55:31 rak-gateway ttn-gateway[1339]: # no valid GPS coordinates available yet
Dec 18 15:55:31 rak-gateway ttn-gateway[1339]: ##### END #####
Dec 18 15:55:31 rak-gateway ttn-gateway[1339]: JSON up: {“stat”:{“time”:“2019-12-18 15:54:05 GMT”,“rxnb”:0,“rxok”:0,“rxfw”:0,"ack$
Dec 18 15:55:31 rak-gateway ttn-gateway[1339]: INFO: [up] PUSH_ACK received in 39 ms
Dec 18 15:55:31 rak-gateway ttn-gateway[1339]: INFO: [down] PULL_ACK received in 38 ms
Dec 18 15:55:31 rak-gateway ttn-gateway[1339]: INFO: [down] PULL_ACK received in 38 ms
Dec 18 15:55:31 rak-gateway ttn-gateway[1339]: INFO: [down] PULL_ACK received in 38 ms
Dec 18 15:55:31 rak-gateway ttn-gateway[1339]: INFO: Disabling GPS mode for concentrator’s counter…
Dec 18 15:55:31 rak-gateway ttn-gateway[1339]: INFO: host/sx1301 time offset=(1576682312s:487459 s) - drift=58 s
Dec 18 15:55:31 rak-gateway ttn-gateway[1339]: INFO: Enabling GPS mode for concentrator’s counter.
Dec 18 15:55:31 rak-gateway ttn-gateway[1339]: ##### 2019-12-18 15:54:35 GMT #####
Dec 18 15:55:31 rak-gateway ttn-gateway[1339]: ### [UPSTREAM] ###
Dec 18 15:55:31 rak-gateway ttn-gateway[1339]: # RF packets received by concentrator: 0
Dec 18 15:55:31 rak-gateway ttn-gateway[1339]: # CRC_OK: 0.00%, CRC_FAIL: 0.00%, NO_CRC: 0.00%
Dec 18 15:55:31 rak-gateway ttn-gateway[1339]: # RF packets forwarded: 0 (0 bytes)
Dec 18 15:55:31 rak-gateway ttn-gateway[1339]: # PUSH_DATA datagrams sent: 1 (113 bytes)
Dec 18 15:55:31 rak-gateway ttn-gateway[1339]: # PUSH_DATA acknowledged: 100.00%
Dec 18 15:55:31 rak-gateway ttn-gateway[1339]: ### [DOWNSTREAM] ###
Dec 18 15:55:31 rak-gateway ttn-gateway[1339]: # PULL_DATA sent: 3 (100.00% acknowledged)
Dec 18 15:55:31 rak-gateway ttn-gateway[1339]: # PULL_RESP(onse) datagrams received: 0 (0 bytes)
Dec 18 15:55:31 rak-gateway ttn-gateway[1339]: # RF packets sent to concentrator: 0 (0 bytes)
Dec 18 15:55:31 rak-gateway ttn-gateway[1339]: # TX errors: 0
Dec 18 15:55:31 rak-gateway ttn-gateway[1339]: # TX rejected (collision packet): 0.00% (req:2, rej:0)
Dec 18 15:55:31 rak-gateway ttn-gateway[1339]: # TX rejected (collision beacon): 0.00% (req:2, rej:0)
Dec 18 15:55:31 rak-gateway ttn-gateway[1339]: # TX rejected (too late): 0.00% (req:2, rej:0)
Dec 18 15:55:31 rak-gateway ttn-gateway[1339]: # TX rejected (too early): 0.00% (req:2, rej:0)
Dec 18 15:55:31 rak-gateway ttn-gateway[1339]: # BEACON queued: 0
Dec 18 15:55:31 rak-gateway ttn-gateway[1339]: # BEACON sent so far: 0
Dec 18 15:55:31 rak-gateway ttn-gateway[1339]: # BEACON rejected: 0
Dec 18 15:55:31 rak-gateway ttn-gateway[1339]: ### [JIT] ###
Dec 18 15:55:31 rak-gateway ttn-gateway[1339]: # SX1301 time (PPS): 2102683136
Dec 18 15:55:31 rak-gateway ttn-gateway[1339]: src/jitqueue.c:448:jit_print_queue(): INFO: [jit] queue is empty
Dec 18 15:55:31 rak-gateway ttn-gateway[1339]: ### [GPS] ###
Dec 18 15:55:31 rak-gateway ttn-gateway[1339]: # Invalid time reference (age: 1576684445 sec)
Dec 18 15:55:31 rak-gateway ttn-gateway[1339]: # no valid GPS coordinates available yet
Dec 18 15:55:31 rak-gateway ttn-gateway[1339]: ##### END #####
Dec 18 15:55:31 rak-gateway ttn-gateway[1339]: JSON up: {“stat”:{“time”:“2019-12-18 15:54:05 GMT”,“rxnb”:0,“rxok”:0,“rxfw”:0,"ack$
Dec 18 15:55:31 rak-gateway ttn-gateway[1339]: INFO: [up] PUSH_ACK received in 39 ms
Dec 18 15:55:31 rak-gateway ttn-gateway[1339]: INFO: [down] PULL_ACK received in 38 ms
Dec 18 15:55:31 rak-gateway ttn-gateway[1339]: INFO: [down] PULL_ACK received in 38 ms
Dec 18 15:55:31 rak-gateway ttn-gateway[1339]: INFO: [down] PULL_ACK received in 38 ms
Dec 18 15:55:31 rak-gateway ttn-gateway[1339]: INFO: Disabling GPS mode for concentrator’s counter…
Dec 18 15:55:31 rak-gateway ttn-gateway[1339]: INFO: host/sx1301 time offset=(1576682312s:487459 s) - drift=58 s
Dec 18 15:55:31 rak-gateway ttn-gateway[1339]: INFO: Enabling GPS mode for concentrator’s counter.
Dec 18 15:55:31 rak-gateway ttn-gateway[1339]: ##### 2019-12-18 15:54:35 GMT #####
Dec 18 15:55:31 rak-gateway ttn-gateway[1339]: ### [UPSTREAM] ###
Dec 18 15:55:31 rak-gateway ttn-gateway[1339]: # RF packets received by concentrator: 0
Dec 18 15:55:31 rak-gateway ttn-gateway[1339]: # CRC_OK: 0.00%, CRC_FAIL: 0.00%, NO_CRC: 0.00%
Dec 18 15:55:31 rak-gateway ttn-gateway[1339]: # RF packets forwarded: 0 (0 bytes)
Dec 18 15:55:31 rak-gateway ttn-gateway[1339]: # PUSH_DATA datagrams sent: 1 (113 bytes)
Dec 18 15:55:31 rak-gateway ttn-gateway[1339]: # PUSH_DATA acknowledged: 100.00%
Dec 18 15:55:31 rak-gateway ttn-gateway[1339]: ### [DOWNSTREAM] ###
Dec 18 15:55:31 rak-gateway ttn-gateway[1339]: # PULL_DATA sent: 3 (100.00% acknowledged)
Dec 18 15:55:31 rak-gateway ttn-gateway[1339]: # PULL_RESP(onse) datagrams received: 0 (0 bytes)
Dec 18 15:55:31 rak-gateway ttn-gateway[1339]: # RF packets sent to concentrator: 0 (0 bytes)
Dec 18 15:55:31 rak-gateway ttn-gateway[1339]: # TX errors: 0
Dec 18 15:55:31 rak-gateway ttn-gateway[1339]: # TX rejected (collision packet): 0.00% (req:2, rej:0)
Dec 18 15:55:31 rak-gateway ttn-gateway[1339]: # TX rejected (collision beacon): 0.00% (req:2, rej:0)
Dec 18 15:55:31 rak-gateway ttn-gateway[1339]: # TX rejected (too late): 0.00% (req:2, rej:0)
Dec 18 15:55:31 rak-gateway ttn-gateway[1339]: # TX rejected (too early): 0.00% (req:2, rej:0)
That’s not really true, as pointed out earlier, in the one case you’ve shown so far where a downlink was both requested and there was an uplink to respond it to, the console shows one as being sent.
You’d need to replicate that situation and capture information for/from the gateway at the same time - though not seeing it there would not be definitive, as if there are other gateways listed as receiving the uplink, the downlink could have been sent by another as well.
During the day I updated my RAK831+RPI3 GW according the instructions on TTN websb site. Suddenly downlink is again working… even with my ESP-single channel gw?
Somethings must have changed in the TTN backend since yesterday, but I have no idea of what or why the change occured. As I previously wrote, I have tested with two GW:s and two different nodes, yesterday the downlink failed and this evening every downlink packet are received.
That was the problem. It was in my custom made device and it’s program. Now I programmed it to follow Class A definition and I get all messages to and from TTN. Thank you for all help.