I am developing a custom application that transmits 4 bytes packets every minute.
Arduino UNO + Dragino LoRa Shield + MCCI LMIC
Device connects to TTN V3 using OTAA with ADR enabled.
Stationary device at 3-4m from gateway. Data reception is exceptional with no packet loss.
The issue is that every ~4hours the data rate drops (spread factor goes from 7 to 9) and then eventually recovers. Looking at the TTN console does not give any clue to what is going on.
Any clue on what is happening? Suggestions on experiments to run to debug?
Start by moving your node further away, can also possibly place in in room next door with a wall (brick) in between to drop the RSSI, they don’t like high RSSI values, you possibly can damage the gateway or node
thank you for your suggestion. I will rework the application to send data less often to reduce the airtime.
Do you believe this is the reason for the data rate behavior?
Looking a the debug output of the LMIC I see a EV_LINK_DEAD when the data rate initially drops and an EV_LINK_ALIVE when the datarate finally goes back to normal.
I have LMIC_setLinkCheckMode enabled. I have read in some old forum that it should be disabled for TTN. Is this the right setting for TTN?
thanks again!
Do you use confirmed uplinks? If your node does not receive a confirmation, it will increase the SF.
Each confirmation means a download, but the number of downloads is limited. I sometimes observed nodes in the log of my gateway that show this behaviour. After a few uploads TTS CE seems to stop the confirmation.
btw: I enabled “Enforce duty cycle” for my gateway.
The uplinks are unconfirmed or at least that is how I interpret the LMIC documentation.
This is what I use to send the data:
LMIC_setTxData2_strict(1, buf, 4, 0);
I have the “enforce duty cycle” set in the TTN console->gateway->general settings->lorawan options. Is this the setting you mention?
This looks like the node wants to have an answer from the TTS-server to determine the link-quality. These answers are downloads (from server/gateway to node) and limited by FUP and Duty Cycle.
“enforce duty cycle” is the option in the console I meant.
Disabling the LinkCheckMode seem to make the issue go away (it’s been ~12h now).
However I don’t see any difference in the console even when set to verbose mode between linkmodecheck on and off.
Is there a way to change the frequency of the LMIC link checks so I can activate the feature without any side effects?
I have the “enforce duty cycle” set in the console.
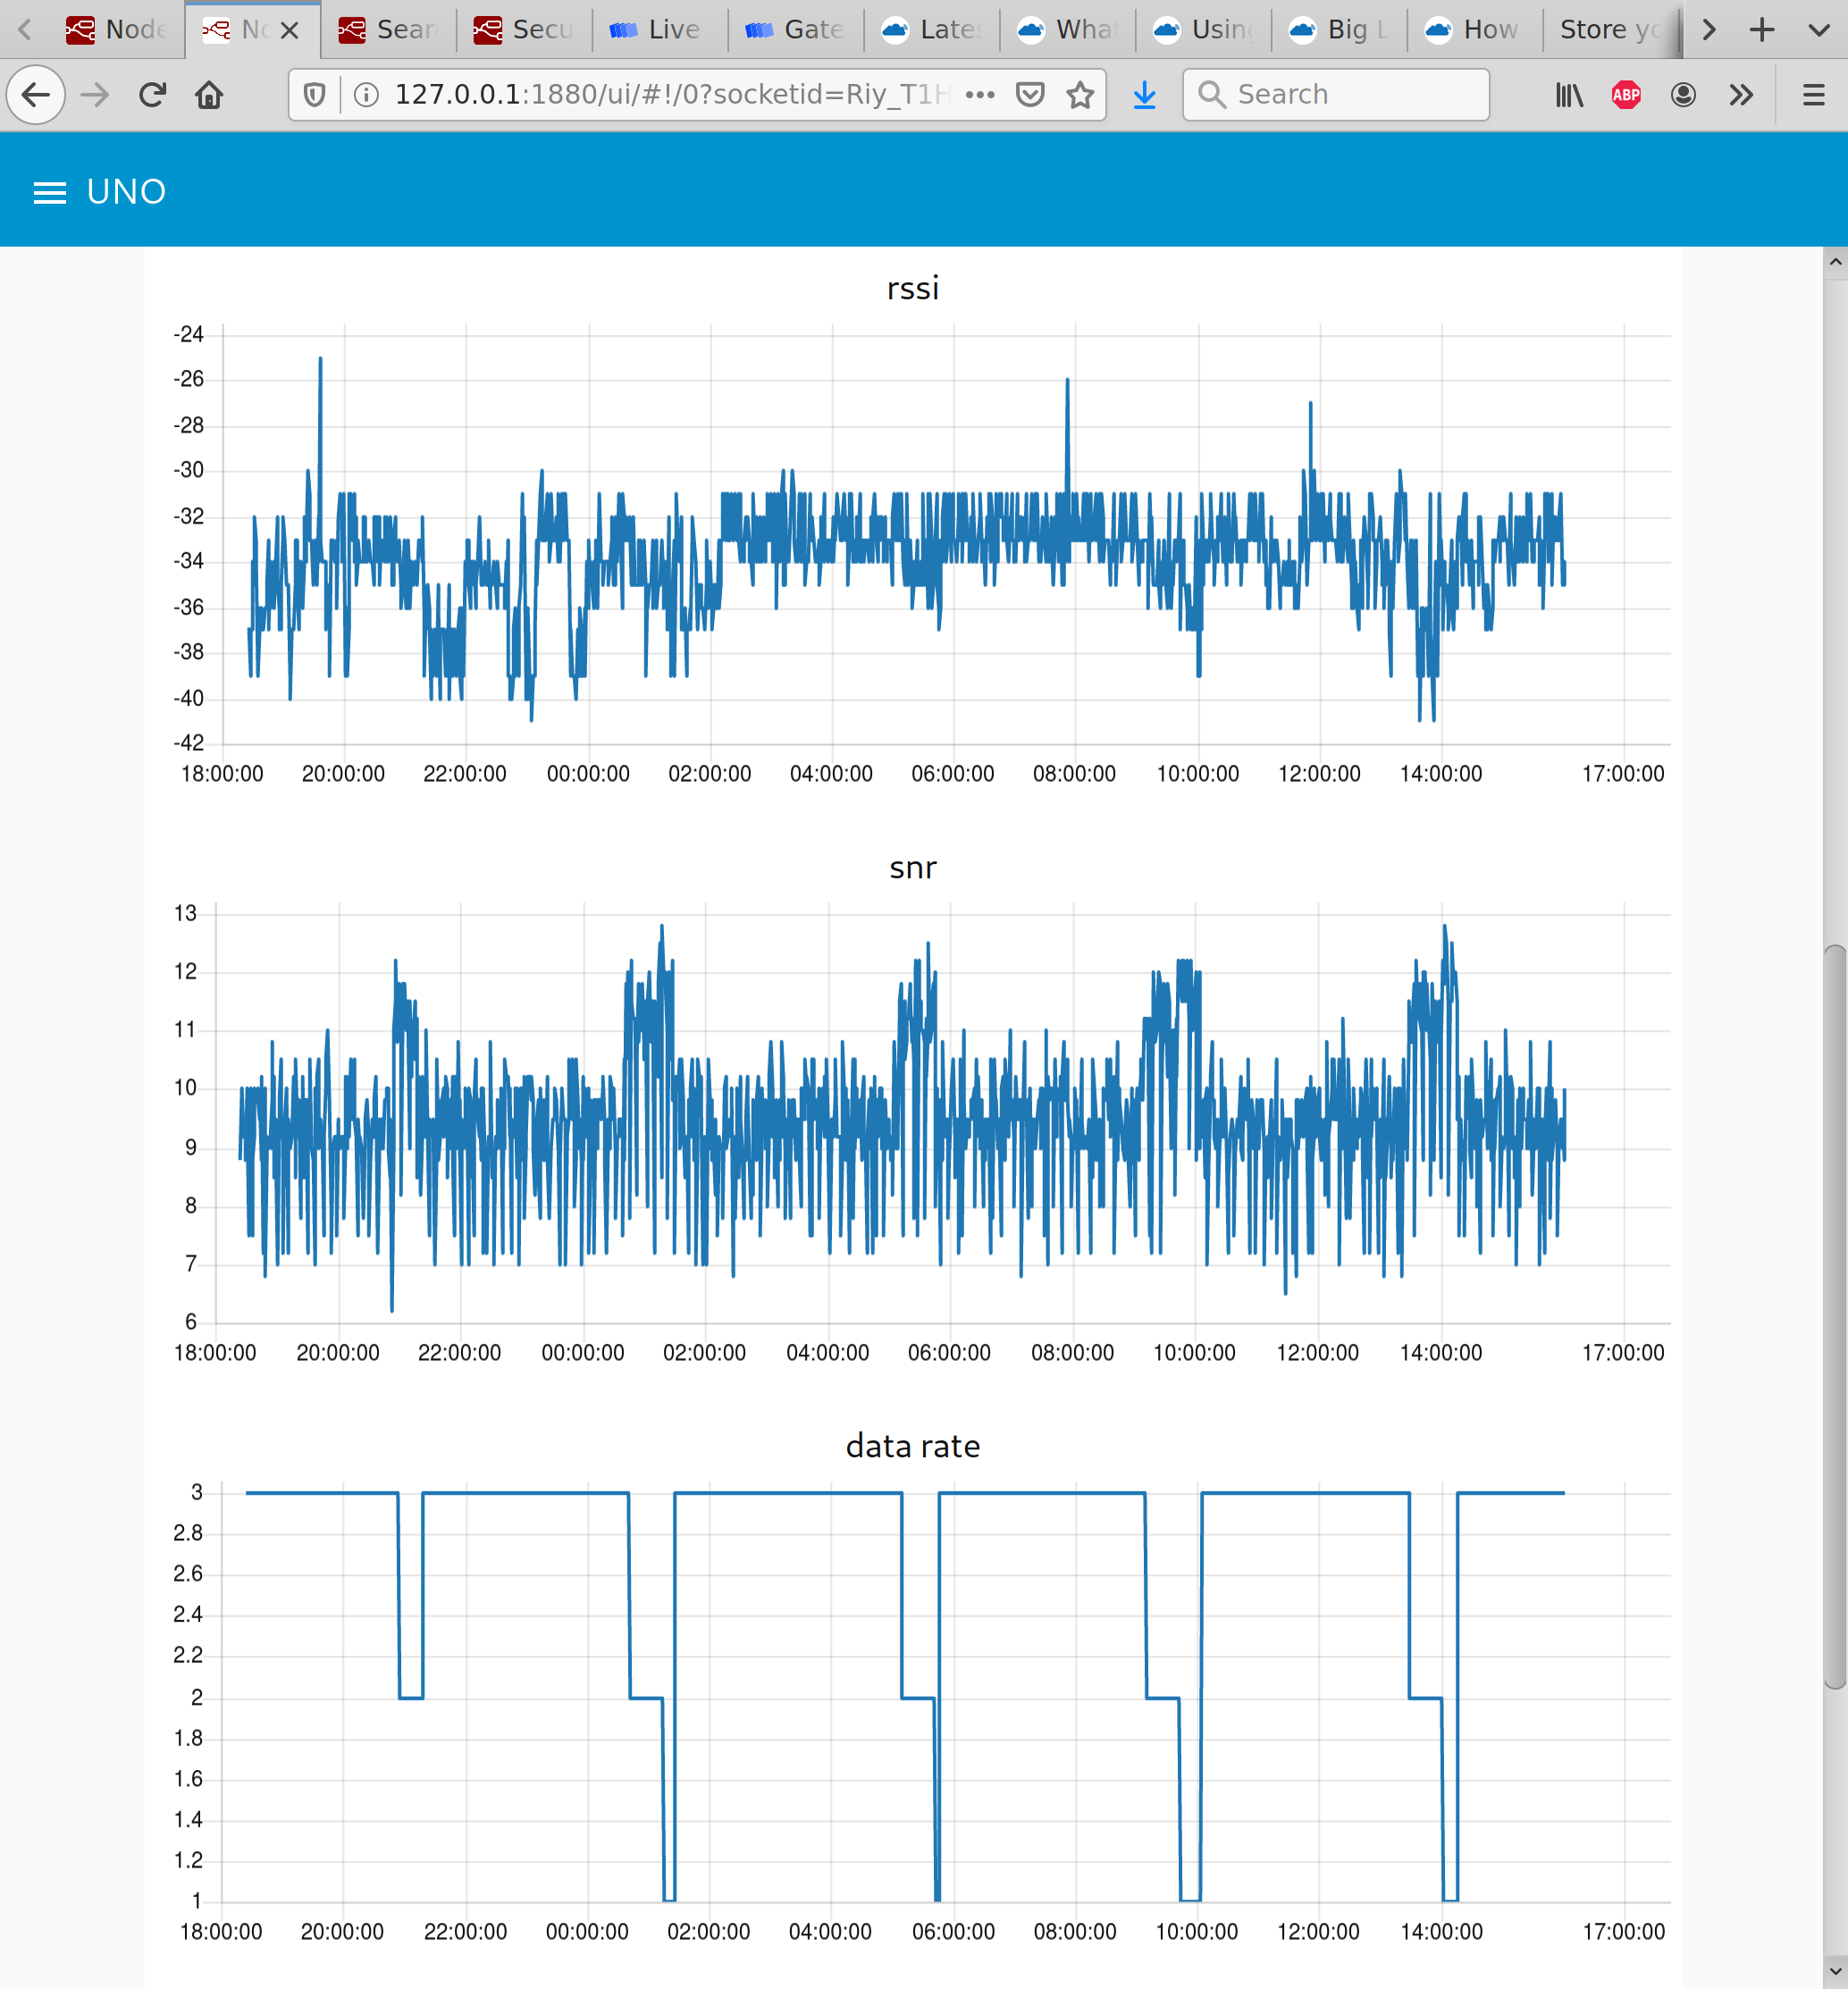
Not a solution for your problem but the correlation between SNR and Data Rate (DR) in your graph could possibly be explained as follows (assumption):
In the graph DR/SF and SNR appear strongly correlated while RSSI stays/varies more or less the same.
So the signal stays about the same. When DR drops the Spreading Factor (SF) increases. In the graph when SF increases (DR decreases) then SNR also increases.
Using a higher SF, less strong signals can be correctly received/decoded which at lower SF may not.
If the signal strength stays the same but SF is increased (DR is decreased) this may result in a higher (perceived) SNR.
In that case the (increasing) SNR peaks in your graph are the result of the (decreasing) dips in DR (and not vice versa).
I agree with your assessment.
Unfortunately, the interaction between LMIC and TTN makes the SF increase without any apparent reason (i.e. both SNR and RSSi were good before the drop in speed).
I saw that too and was going to flag but I know little about the LMIC code structure/operation details so thought best of it. What you could try is increase node/gw seperation (how far apart are they at the moment?) and add say 10m + ideally an absorber like a wall inbetween…then look again at how value changes…what GW are you using - what RSSI value is reported in the GW console log?
Amended: just re-read OP and see you are only 3-4m away so likely that is too close - follow advice and increase distance (Also I see you did increase distance earlier with GW reported RSSI dropping in later post - so would not expect ‘19’ to represent RX dbm as link largely symetric assuming similar GW/node power Tx levels and similar Tx efficiency subject to ant gain etc.) but still worth seeing how the value varies with distance…and assuming you dont have a 2nd GW in your lab area very close (that caught me out once when checking levels with distance - moved the node too close to another GW in building! - Dho!)
First, be aware that SNR and RSSI values on the node (elements of the LMIC structure) are for downlinks only (signal from gateway). SNR and RSSI of uplinks from the node are only seen by the gateway and are not available on the node.
For correct calculation of SNR and RSSI values for downlinks received by the node see:
Note:
In the code the following is used to check if the MCCI LMIC library is used, otherwise Classic LMIC is assumed (MCCI_LMIC is LMIC-node specific):
#ifdef MCCI_LMIC
LMIC-node also demonstrates when it makes sense to show SNR and RSSI values on the node (for the rest of the time the SNR and RSSI values make little to no sense).
If the SNR and RSSI values in your graph are taken directly from the node then this will not help determining the relation with changing DR/SF (your problem). Be sure to use the values from the application instead (which are from the uplinks sent by the node and received by the gateway).
If the network decides to change a node’s DR/SF that decision will be based on signal quality of uplinks received by the gateway, not on downlinks received by the node.


 (Also I see you did increase distance earlier with GW reported RSSI dropping in later post - so would not expect ‘19’ to represent RX dbm as link largely symetric assuming similar GW/node power Tx levels and similar Tx efficiency subject to ant gain etc.) but still worth seeing how the value varies with distance…and assuming you dont have a 2nd GW in your lab area very close (that caught me out once when checking levels with distance - moved the node too close to another GW in building! - Dho!)