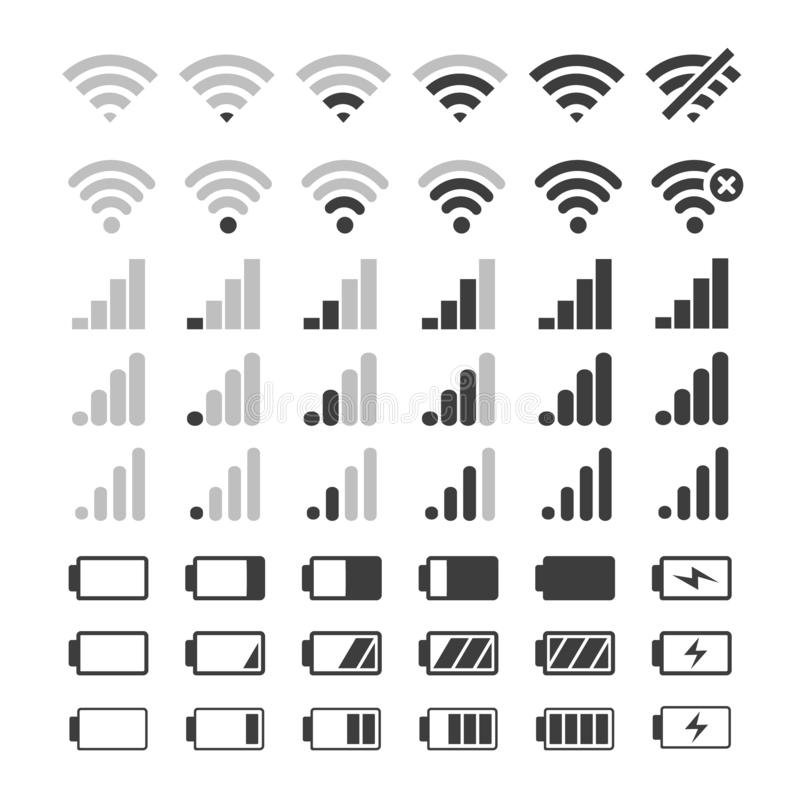
In our application we’d like to be able to represent signal quality of the end nodes with a simple 1-5 bar equivalent, similar to your wifi or cell icons.
For example:
I’m trying to come up with the ideal formula for distilling RSSI & SNR into a rough enough figure that can be translated into those bars. Any suggestions? I’d use RSSI by itself, but I think it would be useful to include SNR as its pretty important.
FWIW, i’ve found that nodes usually drop packets around the RSSI -120db level and the best (node literally on top of the gateway) I’ve seen is -30 RSSI.
Usable SNR range has been roughly packet loss at -12 and max of 9.5
Beware “survivor bias” - you don’t have an RSSI to show at the node, but only at the network, and the one you can show at the network end only includes the packets that actually get through, and not those that do not…
Range of SNR should be lower for high SF: SF12 sensitivity is below -20dB.
Typically you could use SNR when it is negative and RSSI has reached its floor of around -120dB: note that this floor can actually vary depending on your location.
One significant issue has already been mentioned, in that local conditions, i.e. the presense of interference which can limit the RSSI at which signal reception occurs.
SNR is a much better indication of immenent signal failure in my experience, which I suspect is what is of real interest. RSSI tends to not change much at the margins of failure, whereas SNR can change a lot.
A compromise might be to base bars 5,4,3 on RSSI and bars 2,1 on SNR.
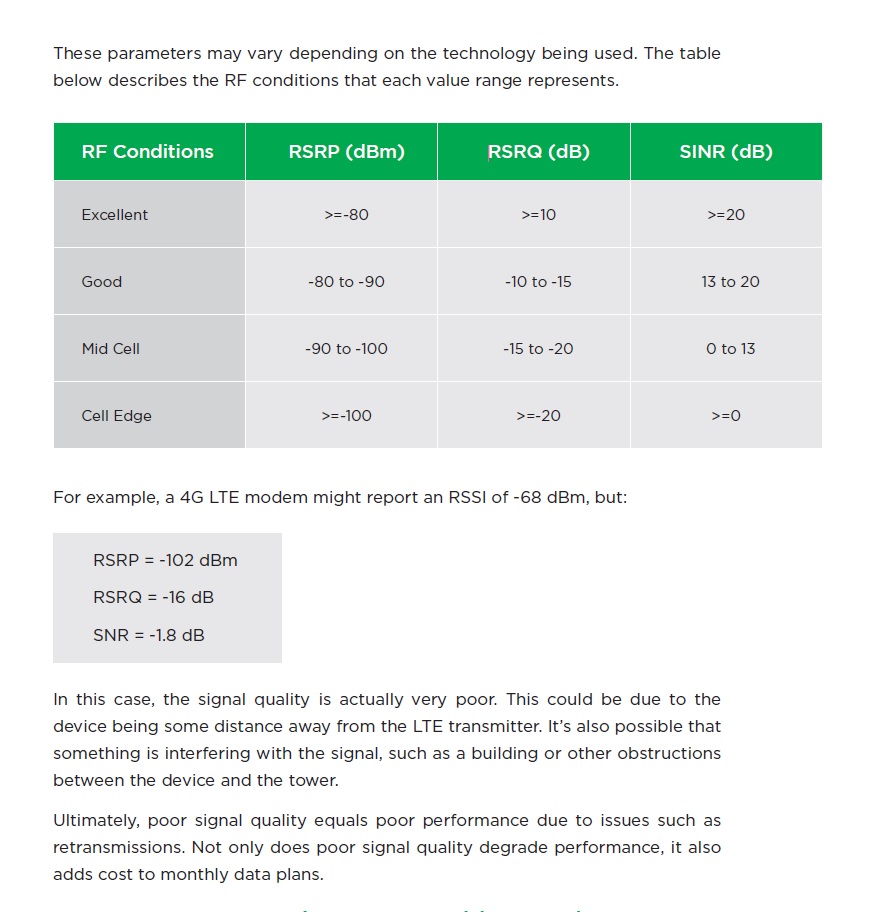
Hi @mrpher, the mobile industry, led by ETSI and 3GPP, standardises a number of metrics and then there is de-facto industry agreement about interpreting the values into 1, 2, 3 bars, etc. as follows:
The key matter is that, for a signal to qualify for “excellent” signal strength, ALL the metrics for excellent need to be met.
don’t forget the impact of ADR if enabled. Simply put it assumes just enough (+ some network determined headroom) is good enough! A node that starts off with high SF and high TX power would hopefully be seen as ‘5 bars’ to start with and the ADR should command moves to shorter time in air with lower SF and also dial back Tx power so would expect to see bars fall in normal operation down to perhaps 1 bar? That would not indicate poor behaviour or bad reception but rather in that case a well behaved and socially acceptable (from spectrum sharing/interference to others perspective) device The objective then is not to aim for 5 bars wherever possible but rather just enough to ensure reliable connection… if local environment changes or if new blockages to line of sight or effective useable reflections turn up then ADR should hopefully back off to compensate…
Excellent recommendations everyone thank you. Especially @Jeff-UK I hadn’t considered the ADR impact, thanks for the tip. In our case all the nodes would be in a fixed location so perhaps that has less of an impact. But in testing, moving objects in between the line of site does indeed have an impact on RSSI and SNR however small.
 don’t forget the impact of ADR if enabled. Simply put it assumes just enough (+ some network determined headroom) is good enough! A node that starts off with high SF and high TX power would hopefully be seen as ‘5 bars’ to start with and the ADR should command moves to shorter time in air with lower SF and also dial back Tx power so would expect to see bars fall in normal operation down to perhaps 1 bar? That would not indicate poor behaviour or bad reception but rather in that case a well behaved and socially acceptable (from spectrum sharing/interference to others perspective) device
  The objective then is not to aim for 5 bars wherever possible but rather just enough to ensure reliable connection… if local environment changes or if new blockages to line of sight or effective useable reflections turn up then ADR should hopefully back off to compensate…