As I wrote above, my nodes are seen in traffic tab of my gateway, but from TTN consol, under my devise, the field ‘status’ shows ‘13 days ago’, while the nodes was display in the traffic tab, today…
my TTOG gateway is seen each 3 minutes, which look long ( ‘Last Seen’ field), isn’t? Can it be a GSM (3G) network issue? (I am used to see the ‘Last Seen’ field to be update each 12-15 sec)
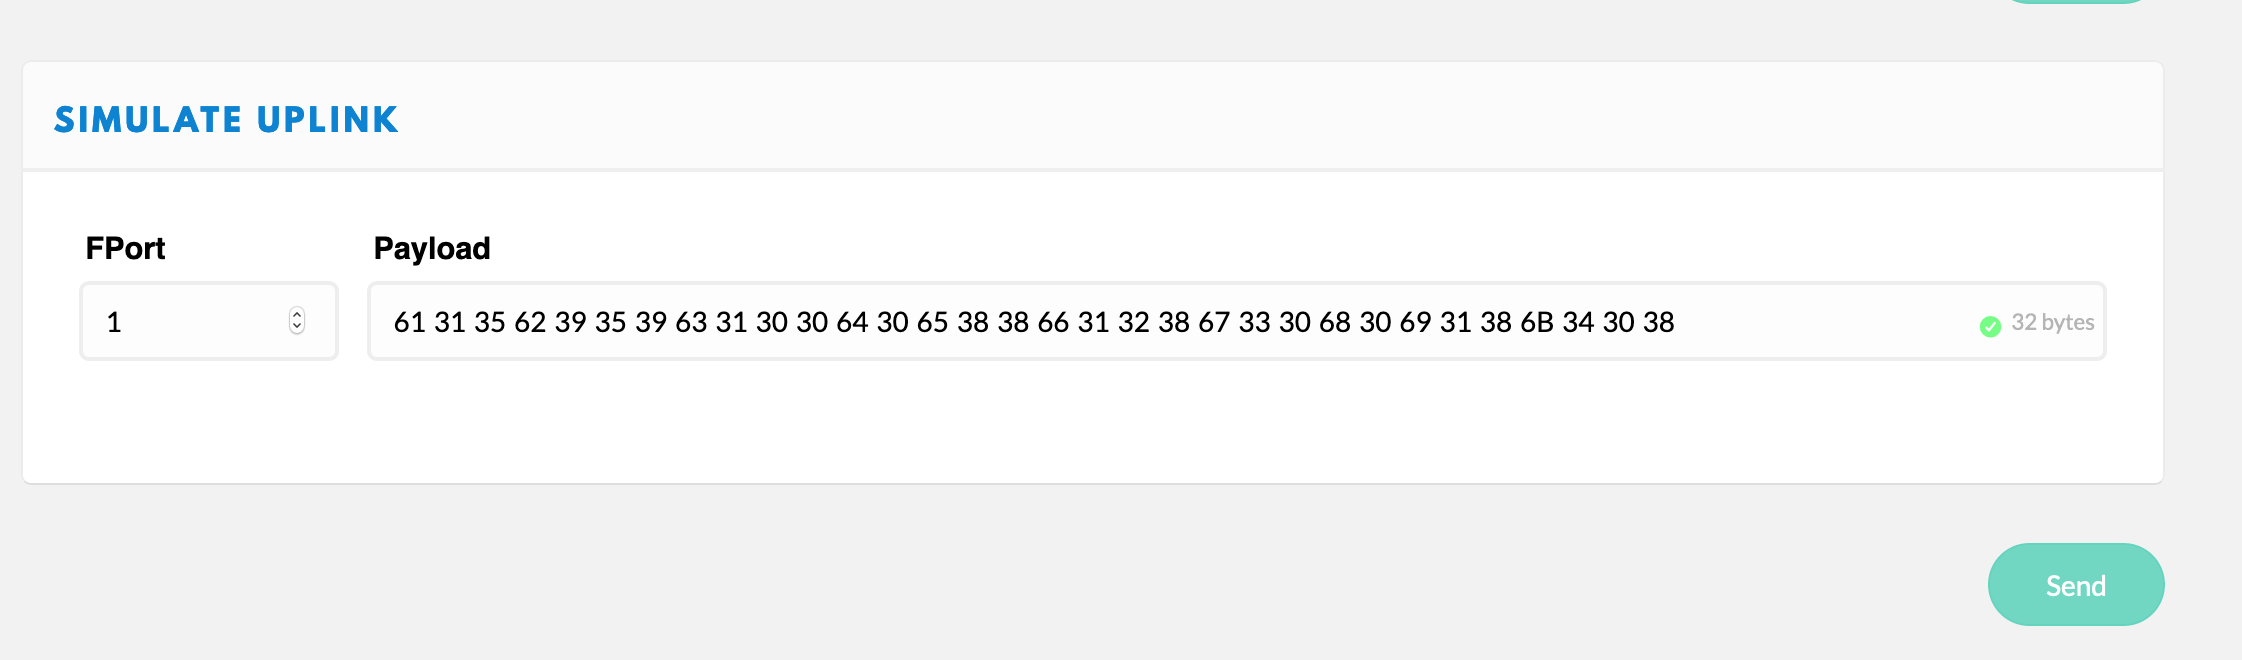
After I decript my message, from my devise in TTN console, I pasted the following
That the messages are being received and seem to decrypt by other methods is a positive sign.
The frame count is part of the lorawan header, if I recall the 7th and 8th bytes. Look at your still-encrypted hex dumps and see if that is changing in your example the little-endian bytes in question are
You’d want to see that this number was greater than the frame count on the last packet accepted and decoded by TTN
(Technically these are only the low 16 bits of a 32 bit number; the wrapping to additional upper bits is supposed to be tracked by both ends. The MIC checksum calculation uses the full 32-bit value, so if an end guesses wrong about what the upper bits are, the MIC check will fail. If your command line tool validated the MIC without being given upper bits, then the upper bits are likely zero, but if TTN thinks they should be non-zero based on past history of having wrapped over, the packet will be rejected there)
You’d want to see that this number was greater than the frame count on the last packet accepted and decoded by TTN
I am sorry, but this is still not clear for me. Where can check the frame count (and how to reset)?
Is this ?
I suppose if I restart the node FCnt take the value of 0, so why it did not solve my problem?
How can I reset it?
(in any case when I restart my node, the first Tx is not recorded)
Today, I went to the field and I look at the gateway log. I got a such lines
GPS coordinates: latitude 46.21502, longitude 6.01250, altitude 464 m
I suppose if I restart the node FCnt take the value of 0, so why it did not solve my problem?
Restarting the node doesn’t solve anything, on the contrary it can easily cause a problem, because then the node is using a frame count that the network has already seen.
Or trying to use a join nonce that the network has already seen.
Restarting a node is only safe if the node has persistent memory of what it has previously used, otherwise it needs to be avoided.
As repeatedly mentioned, gateways have no state - so going out in the field to check the gateway doesn’t really help debug a case where raw messages from the node are being passed up, but rejected by the server. Your stats message “RF packets forwarded: 0 (0 bytes)” means the gateway received nothing, but only during the period covered by that stats message, which is typically only 30 seconds to at most a few minutes.
But I still have the same question:
what can I do to solve my problem?
How can reset the frame count?
My nodes transmit the messages
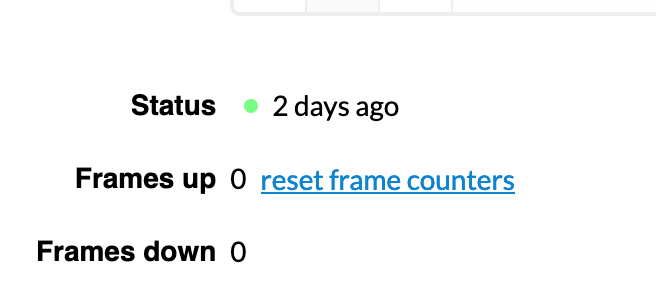
The nodes messages are seen in traffic tab of my gateway (the gateway has been restored and reconfigured yesterday)
The packets are well decrypted (lora-packet-decode) and valid, and I can oberseve the FCnt number as well
The devises (TTN console) are not seen (‘Status’ field)
the log gateway show ‘Tx rejected’ messages
Keep in mind, I already experience with a IC880A (see my first post) gateway, and as soon I replaced my IC880A gateway with the TTOG gateway, the problem was solved with the TTIG gateway until 25 of July.
Have. a nice day.
(I am leaving for 2 weeks holiday tomorrow)
Hello,
I am back from my holiday and before elaving, I leave my infrastructure running, even if the gateway do not trnasmit.
Suddently, on the 13 of august, two nodes transmit and it still tranmitting today.
The node 4, were switch off and for the node 1, I badely inserted the SD card and I devloped the code to not continue if the SD card is not inserted. On saturday, as soon as I inserted the SD card, the data were received successfully.
I am a bit surprised that from the 13 of August, from the same moment, the message from the node could be transmit, while I was on holiday (far away from my codes, infrastructure and PC). In other, word, I did nothing.
I suggest a issue with TTN infrastructure and not with my nodes and gateway.
What do you things?
Actually, the node1 stop transmitting this night. This evening, I will go to my orchard and I will switch on the node 4. I will check node 1, but I beleive it a local issue. (this week, I will make all my nodes working with OTAA instead of ABP)