Airteq Milesight AM103 causing too many downlinks

Hi folks,

My school has recently purchased 90× AM103 (CO2 / temp / hum) sensors. During exam surveillance last Thursday I got bored and found out they have NFC and using their app I found out they have LoRaWAN.
I configured and connected it - all went well. Every 10 minutes it sent an uplink.
Now I checked it this morning, and it’s sent 438 uplinks but caused 147 downlinks in three days??

The AM103 is not present in the device repository - I added it manually to TTN. AppEUI, DevEUI and AppKey were present in the device and copied into TTN. LoRaWAN version 1.0.3 also taken from their app. OTAA and ADR enabled. Unconfirmed uplinks.

It is currently hibernating (it should have woken up but apparently it’s drunk) - I can check on it in one and a half hour to try and catch some of those downlinks. Will follow this up with one of those downlinks.

Anyone experienced with this device? School’s looking to hook up all 90 to a dashboard… so I better figure this out in advance :slight_smile:

Cheers, Steven

Did you discover the NFC by disassembly? :grin:

There is some combination of firmware vs TTS that causes Rx1 delay downlink requests to be sent rather persistently because the device does not appear to acknowledge them.

Of late I’ve mostly been using LoRaMAC-node as supplied by ST set to LW v1.0.3. If there was going to be any firmware that should behave, you’d expect that to be correct. But still I see downlinks at the sort of ratio you are seeing. It also occurs to up to date versions of LMIC. I figure that if it’s happening to the Milesight devices too, it does seem to point to TTS.

Another recent discussion somewhere on here has moved investigating this up my list but now we have far more agile / fitter brain power on the case, progress might be a bit faster.

I’ll track down the topic later this morning. Could you check in with Milesight just in case they have some insight in to the issue please.

I am something of a librarian and read datasheets for fun :hushed:

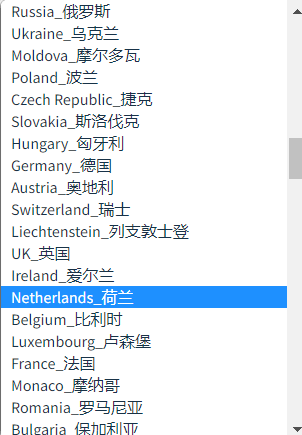
Sent in a ticket. Their country selection entry is diabolical. No alphabetic ordering.
image

Can’t handle this much compliments, dear sir.

Thankfully my first time using them as of yet :sweat_smile:

Here’s a downlink I just received & retrieved:

"data": {
    "@type": "type.googleapis.com/ttn.lorawan.v3.DownlinkMessage",
    "raw_payload": "YNSBCyaDlQACEAGhxC9q",
    "payload": {
      "m_hdr": {
        "m_type": "UNCONFIRMED_DOWN"
      },
      "mic": "ocQvag==",
      "mac_payload": {
        "f_hdr": {
          "dev_addr": "260B81D4",
          "f_ctrl": {
            "adr": true
          },
          "f_cnt": 149,
          "f_opts": "AhAB"
        },
        "full_f_cnt": 149
      }
    },
    "request": {
      "downlink_paths": [
        {
          "uplink_token": "ChkKFwoVaWNodGh1cy1jb2xsZWdlLW10Y2R0EOShtPUFGgsIi6mqoQYQ9/fsQiCg9aegnYk2"
        }
      ],
      "rx1_delay": 5,
      "rx1_data_rate": {
        "lora": {
          "bandwidth": 125000,
          "spreading_factor": 7,
          "coding_rate": "4/5"
        }
      },
      "rx1_frequency": "867900000",
      "rx2_data_rate": {
        "lora": {
          "bandwidth": 125000,
          "spreading_factor": 9,
          "coding_rate": "4/5"
        }
      },
      "rx2_frequency": "869525000",
      "priority": "HIGHEST",
      "frequency_plan_id": "EU_863_870_TTN"
    },
    "correlation_ids": [
      "gs:conn:01GWW4D73Q106JFVNBRQHASH9G",
      "gs:up:host:01GWW4D73XVZT6T6TT3FXGKTNP",
      "gs:uplink:01GX358FW4Q0HR373C7W96GBMC",
      "ns:downlink:01GX358G8ZZ0HVTE7QRK52V5R7",
      "ns:transmission:01GX358G8ZP07N99ZE4FNEY0QG",
      "ns:uplink:01GX358FW5VPDE89QC1P08J9TW",
      "rpc:/ttn.lorawan.v3.GsNs/HandleUplink:01GX358FW51Z0F14JDS9YN9Q8S"
    ]
  },

And another one (omitted details are identical apart from timestamp, correlation IDs and frequency band):

    "@type": "type.googleapis.com/ttn.lorawan.v3.DownlinkMessage",
    "raw_payload": "YNSBCyaElAACEQEG8wpYQg==",
    "payload": {
      "m_hdr": {
        "m_type": "UNCONFIRMED_DOWN"
      },
      "mic": "8wpYQg==",
      "mac_payload": {
        "f_hdr": {
          "dev_addr": "260B81D4",
          "f_ctrl": {
            "adr": true
          },
          "f_cnt": 148,
          "f_opts": "AhEBBg=="
        },
        "full_f_cnt": 148
      }
    },

The challenge here, which is why it’s loitered on my todo list of late, is to grab all of the next uplink from the device so that the headers can be inspected for any response to the MAC requests.

My console is happily buffering its uplinks and downlinks currently. I can provide you with a bunch, where you specify if you want just a single or two series of downlinks + uplink, or more?

No LNS should send confirmed downlinks otherwise the potential for a perpetual loop could occur.

If you want to try it, add a command to a device to do a hardware reset, send the command via a confirmed downlink and stand back …

As above, we need to see what the stack is sending in the way of an acknowledgement to the MAC command in the next uplink.

For which I think we need to bring some grownups to the party - like @adrianmares & @KrishnaIyerEaswaran2 - principle question being how we capture the raw data from the gateway & the device consoles.

To assist with seeing under the hood, perhaps @mluis1 could advise if there is a relative simple way to get more debug trace from the very heart of LoRaMAC-node - I’m using STM32CubeMX 1.2.0 which is v4.5.1 (not MX 1.3.0 which is v4.6.0 due to some logistical issues with provisioning) but I’m happy to use v4.7.0 from GitHub on a B-L072Z-LRWAN1 or LR1110DVK1

Just download the whole lot with the Export as JSON.

And then if Verbose stream isn’t turned on, turn it on and wait for some downlink action and do the same.

Don’t post them here - bit too much data - I’ll organise somewhere for them to go.

Got two hours worth of uplinks & downlinks ready in JSON (non-verbose). An empty console is now going to buffer all verbose info. Will also open a tab for our gateway in case that could be of any help. I’ll be happy to provide any information I can get my hands on!

Can you do the same with Verbose mode on - that will tell much more what’s happining wrt LNS responses/messages, any dev ack etc.

Ignore…I carried on reading!:

Note to self - read (all) 1st type later! :slight_smile:

Steven is on the case.

Yes to gateway please. I’ll setup a device to do the same here to strike whilst the iron is hot!

1 Like

Just spotted as you pointed out :wink:

Hey - as this is a LoRaWAN 1.0.x end device, the FOpts in the downlinks are in plain text and can be decoded. The payload AhEBBg== mentioned above contains two commands - a LinkCheckAns, which is requested by the end device to check if it still has coverage (and contains the number of gateways, 1, and the signal margin), and a DevStatusReq, requested by the LNS in order to periodically check what is the status of the end device.

The end device can do a LinkCheckReq any time it wants, and it’s up to the end device firmware. The DevStatusReq has two periods in the things stack - over time, by default 24 hours, and over messages, by default every 200 messages.

On the end device side both the requests and responses have events associated, which can be seen in the verbose event stream.

Do you have a handy tool for this?

The issue at hand is the Rx1 setting that keeps being send - our messages thread from mid-Feb refers.

Not a portable one unfortunately.

With that being said, the verbose events output in the end device view will contain these details. Only in cases in which only the gateway view is available this manual decoding is needed in order to look inside the downlinks.

I now have two hours worth of verbose device & gateway data. I’ll keep on collecting, but I noticed already that the device requested three LinkCheckReqs in 12 uplinks…

I have been digging around in the AM103 datasheet with the knowledge that the cause is a LinkCheckReq (thank you @adrianmares) and as it turns out, there is a setting in the app/device named “Rejoin Mode” which is enabled by default and set to 32 minutes.
Meaning that it checks the network connection twice an hour or 50 times a day… big oof.

Next time I am at school I will make sure to disable this setting and I expect this problem to be resolved.
Sorry @descartes but this case will not be helpful anymore to you.

I can now sleep in peace and I updated my ticket at Milesight to request this setting to be disabled by default. Who knows.

Blooming heck - that’s just silly.

Let’s see, you may be hit with the Rx1 downlinks - after a couple of hours mines managed to get a couple of downlinks.

Rather odd the school didn’t enable the LoRaWAN element of the devices. Maybe you can use it to create a dashboard and/or use the data for a project?

Ikr… if they really want to enable it at least make it once or twice a day at most.

:wink:
They probably were sold to ‘us’ with ‘yeah you can connect them to a dashboard’ but then the AirTeq IoT dashboard costs some ridiculous amount of money and school probably didn’t even know LoRa let alone that we have a gateway on our roof ourselves :smiley:

It occurs to me that a web hook that analyses the messages at the MAC level would be good - and could in theory with a aid of a payload formatter, analyse the content too.

Now I need to find someone with expertise in big data …