Experiencing Packet Loss on v3 but not v2

I’m using OTAA, I attached the ‘Network Layer’ settings I’m using on EU1v3 for the devices as screenshot.
2021-09-02 19_11_21-General settings - fi-weather-dev01 - The Things Network - Brave

My nodes are based on Arduinos with an RFM95 module, the library I use is ‘MCCI LoRaWAN LMIC library’, the version of the library I’m using is v4.0.0, so it is the latest version.
The libary is of course configured for 868MHz in ‘lmic_project_config.h’ :

// project-specific definitions
#define CFG_eu868 1
//#define CFG_us915 1
//#define CFG_au915 1
//#define CFG_as923 1
// #define LMIC_COUNTRY_CODE LMIC_COUNTRY_CODE_JP	/* for as923-JP */
//#define CFG_kr920 1
//#define CFG_in866 1
#define CFG_sx1276_radio 1
//#define LMIC_USE_INTERRUPTS

I checked in my backend, at least I see also processed uplinks with 868.5mhz, so not all 868.5mhz uplinks are lost.

Good info, thanks.

And this too!

@descartes here an example of a lost uplink which is not at 868.5MHz.
EU1 v3 Application/Device with one UDP gateway in reach which is also registered in EU1 v3.

Metadata of the correctly processed uplink:

{
  "name": "gs.up.receive",
  "time": "2021-09-03T18:33:46.886265454Z",
  "identifiers": [
    {
      "gateway_ids": {
        "gateway_id": "hir-ttn01v3"
      }
    },
    {
      "gateway_ids": {
        "gateway_id": "hir-ttn01v3",
        "eui": "4836372047001D00"
      }
    }
  ],
  "data": {
    "@type": "type.googleapis.com/ttn.lorawan.v3.UplinkMessage",
    "raw_payload": "QPOzCyYATgABO/LC8hhbcH2f",
    "payload": {
      "m_hdr": {
        "m_type": "UNCONFIRMED_UP"
      },
      "mic": "W3B9nw==",
      "mac_payload": {
        "f_hdr": {
          "dev_addr": "260BB3F3",
          "f_ctrl": {},
          "f_cnt": 78
        },
        "f_port": 1,
        "frm_payload": "O/LC8hg="
      }
    },
    "settings": {
      "data_rate": {
        "lora": {
          "bandwidth": 125000,
          "spreading_factor": 7
        }
      },
      "coding_rate": "4/5",
      "frequency": "868100000",
      "timestamp": 2553430643,
      "time": "2021-09-03T18:33:47.139654Z"
    },
    "rx_metadata": [
      {
        "gateway_ids": {
          "gateway_id": "hir-ttn01v3",
          "eui": "4836372047001D00"
        },
        "time": "2021-09-03T18:33:47.139654Z",
        "timestamp": 2553430643,
        "rssi": -73,
        "channel_rssi": -73,
        "snr": 9,
        "uplink_token": "ChkKFwoLaGlyLXR0bjAxdjMSCEg2NyBHAB0AEPOEycEJGgwIitXJiQYQsvrGpgMguKLOoqiIFg=="
      }
    ],
    "received_at": "2021-09-03T18:33:46.886160690Z",
    "correlation_ids": [
      "gs:conn:01FEKJJD5D0GTQX6M9SSC6H9X1",
      "gs:uplink:01FEPF0BM6FQRHCZESF9PBJ4BW"
    ]
  },
  "correlation_ids": [
    "gs:conn:01FEKJJD5D0GTQX6M9SSC6H9X1",
    "gs:uplink:01FEPF0BM6FQRHCZESF9PBJ4BW"
  ],
  "origin": "ip-10-100-5-46.eu-west-1.compute.internal",
  "context": {
    "tenant-id": "CgN0dG4="
  },
  "visibility": {
    "rights": [
      "RIGHT_GATEWAY_TRAFFIC_READ",
      "RIGHT_GATEWAY_TRAFFIC_READ"
    ]
  },
  "unique_id": "01FEPF0BM6AG2MTX9RFAGXAVV8"
}

Metadata of missing uplink:

{
  "name": "gs.up.receive",
  "time": "2021-09-03T18:28:49.987885825Z",
  "identifiers": [
    {
      "gateway_ids": {
        "gateway_id": "hir-ttn01v3"
      }
    },
    {
      "gateway_ids": {
        "gateway_id": "hir-ttn01v3",
        "eui": "4836372047001D00"
      }
    }
  ],
  "data": {
    "@type": "type.googleapis.com/ttn.lorawan.v3.UplinkMessage",
    "raw_payload": "QPOzCyYATQABUk9iGW7UtTck",
    "payload": {
      "m_hdr": {
        "m_type": "UNCONFIRMED_UP"
      },
      "mic": "1LU3JA==",
      "mac_payload": {
        "f_hdr": {
          "dev_addr": "260BB3F3",
          "f_ctrl": {},
          "f_cnt": 77
        },
        "f_port": 1,
        "frm_payload": "Uk9iGW4="
      }
    },
    "settings": {
      "data_rate": {
        "lora": {
          "bandwidth": 125000,
          "spreading_factor": 7
        }
      },
      "coding_rate": "4/5",
      "frequency": "867700000",
      "timestamp": 2256425572,
      "time": "2021-09-03T18:28:50.133441Z"
    },
    "rx_metadata": [
      {
        "gateway_ids": {
          "gateway_id": "hir-ttn01v3",
          "eui": "4836372047001D00"
        },
        "time": "2021-09-03T18:28:50.133441Z",
        "timestamp": 2256425572,
        "rssi": -72,
        "channel_rssi": -72,
        "snr": 9.25,
        "uplink_token": "ChkKFwoLaGlyLXR0bjAxdjMSCEg2NyBHAB0AEOSk+bMIGgwI4dLJiQYQ/6PEqgMgoK3H69X/FQ==",
        "channel_index": 6
      }
    ],
    "received_at": "2021-09-03T18:28:49.894505471Z",
    "correlation_ids": [
      "gs:conn:01FEKJJD5D0GTQX6M9SSC6H9X1",
      "gs:uplink:01FEPEQ9P3P1XKTDTNZFGGNANE"
    ]
  },
  "correlation_ids": [
    "gs:conn:01FEKJJD5D0GTQX6M9SSC6H9X1",
    "gs:uplink:01FEPEQ9P3P1XKTDTNZFGGNANE"
  ],
  "origin": "ip-10-100-5-46.eu-west-1.compute.internal",
  "context": {
    "tenant-id": "CgN0dG4="
  },
  "visibility": {
    "rights": [
      "RIGHT_GATEWAY_TRAFFIC_READ",
      "RIGHT_GATEWAY_TRAFFIC_READ"
    ]
  },
  "unique_id": "01FEPEQ9P348AGN1H2WXKE46FZ"
}

Hi,

I will follow this problem with more than normal interest : it looks identical to what I posted a few weeks ago.

I counted a loss of 6 % - also messages that were send by my GW, arrived at TTN, but did not appear in the webhook. (but finally adapted my application as 10 % was considered as acceptable)

If possible, please share metadata of messages that are shown in TTN GW live data but not in the TTN node live data (see some of the posts above).

Following message showed up in the TTN GW live data, but not in the TTN node live data

Click to see the full logs
{
  "name": "gs.up.receive",
  "time": "2021-09-07T09:20:31.974378739Z",
  "identifiers": [
    {
      "gateway_ids": {
        "gateway_id": "dragino-lps8-gateway-pdbr"
      }
    },
    {
      "gateway_ids": {
        "gateway_id": "dragino-lps8-gateway-pdbr",
        "eui": "A840411EAA044150"
      }
    }
  ],
  "data": {
    "@type": "type.googleapis.com/ttn.lorawan.v3.UplinkMessage",
    "raw_payload": "QMPECyaAkUYCYPqZvp4gQloE",
    "payload": {
      "m_hdr": {
        "m_type": "UNCONFIRMED_UP"
      },
      "mic": "IEJaBA==",
      "mac_payload": {
        "f_hdr": {
          "dev_addr": "260BC4C3",
          "f_ctrl": {
            "adr": true
          },
          "f_cnt": 18065
        },
        "f_port": 2,
        "frm_payload": "YPqZvp4="
      }
    },
    "settings": {
      "data_rate": {
        "lora": {
          "bandwidth": 125000,
          "spreading_factor": 7
        }
      },
      "coding_rate": "4/5",
      "frequency": "867500000",
      "timestamp": 300747044,
      "time": "2021-09-07T09:20:31.955378Z"
    },
    "rx_metadata": [
      {
        "gateway_ids": {
          "gateway_id": "dragino-lps8-gateway-pdbr",
          "eui": "A840411EAA044150"
        },
        "time": "2021-09-07T09:20:31.955378Z",
        "timestamp": 300747044,
        "rssi": -66,
        "channel_rssi": -66,
        "snr": 6.5,
        "location": {
          "latitude": 51.21161367789357,
          "longitude": 4.452853202819825,
          "source": "SOURCE_REGISTRY"
        },
        "uplink_token": "CicKJQoZZHJhZ2luby1scHM4LWdhdGV3YXktcGRichIIqEBBHqoEQVAQpJK0jwEaDAjf3dyJBhCdgcbQAyCg6a6v4IUB",
        "channel_index": 5
      }
    ],
    "received_at": "2021-09-07T09:20:31.974225565Z",
    "correlation_ids": [
      "gs:conn:01FEZNF0EHCZPH7NFV86TGXJXQ",
      "gs:uplink:01FEZRY6Q691F0WFNMR5JT8A66"
    ]
  },
  "correlation_ids": [
    "gs:conn:01FEZNF0EHCZPH7NFV86TGXJXQ",
    "gs:uplink:01FEZRY6Q691F0WFNMR5JT8A66"
  ],
  "origin": "ip-10-100-5-46.eu-west-1.compute.internal",
  "context": {
    "tenant-id": "CgN0dG4="
  },
  "visibility": {
    "rights": [
      "RIGHT_GATEWAY_TRAFFIC_READ",
      "RIGHT_GATEWAY_TRAFFIC_READ"
    ]
  },
  "unique_id": "01FEZRY6Q6EAYR06Y33Y8DKCJ3"
}

As no-one here has access to that level of information on the stack there is not much that can be done with that, perhaps you could read the thread above so you can see what sort of information we need.

What is the current percentage drop out rate? I’d calculate it myself but my webhook server isn’t getting any traffic from you anymore.

I indeed stopped the webhook, as you earlier convinced me that 10 % dropping rate is acceptable. I already adapted my application to take that into account. I just wanted to help mat89 and as said, I am very interested in his problem looking identically as mine.

And for other readers, I quoted the documentation. I never ever said 10% packet loss was acceptable. I may have said that it was to be expected in a busy RF environment.

As @mat89 appears to have done further research, it may well be there is something more to your packet loss. Do you want to investigate it?

Thanks for the offer and your willingness to further investigate. For the moment I cannot attribute enough time myself and I can live with my adapted solution.

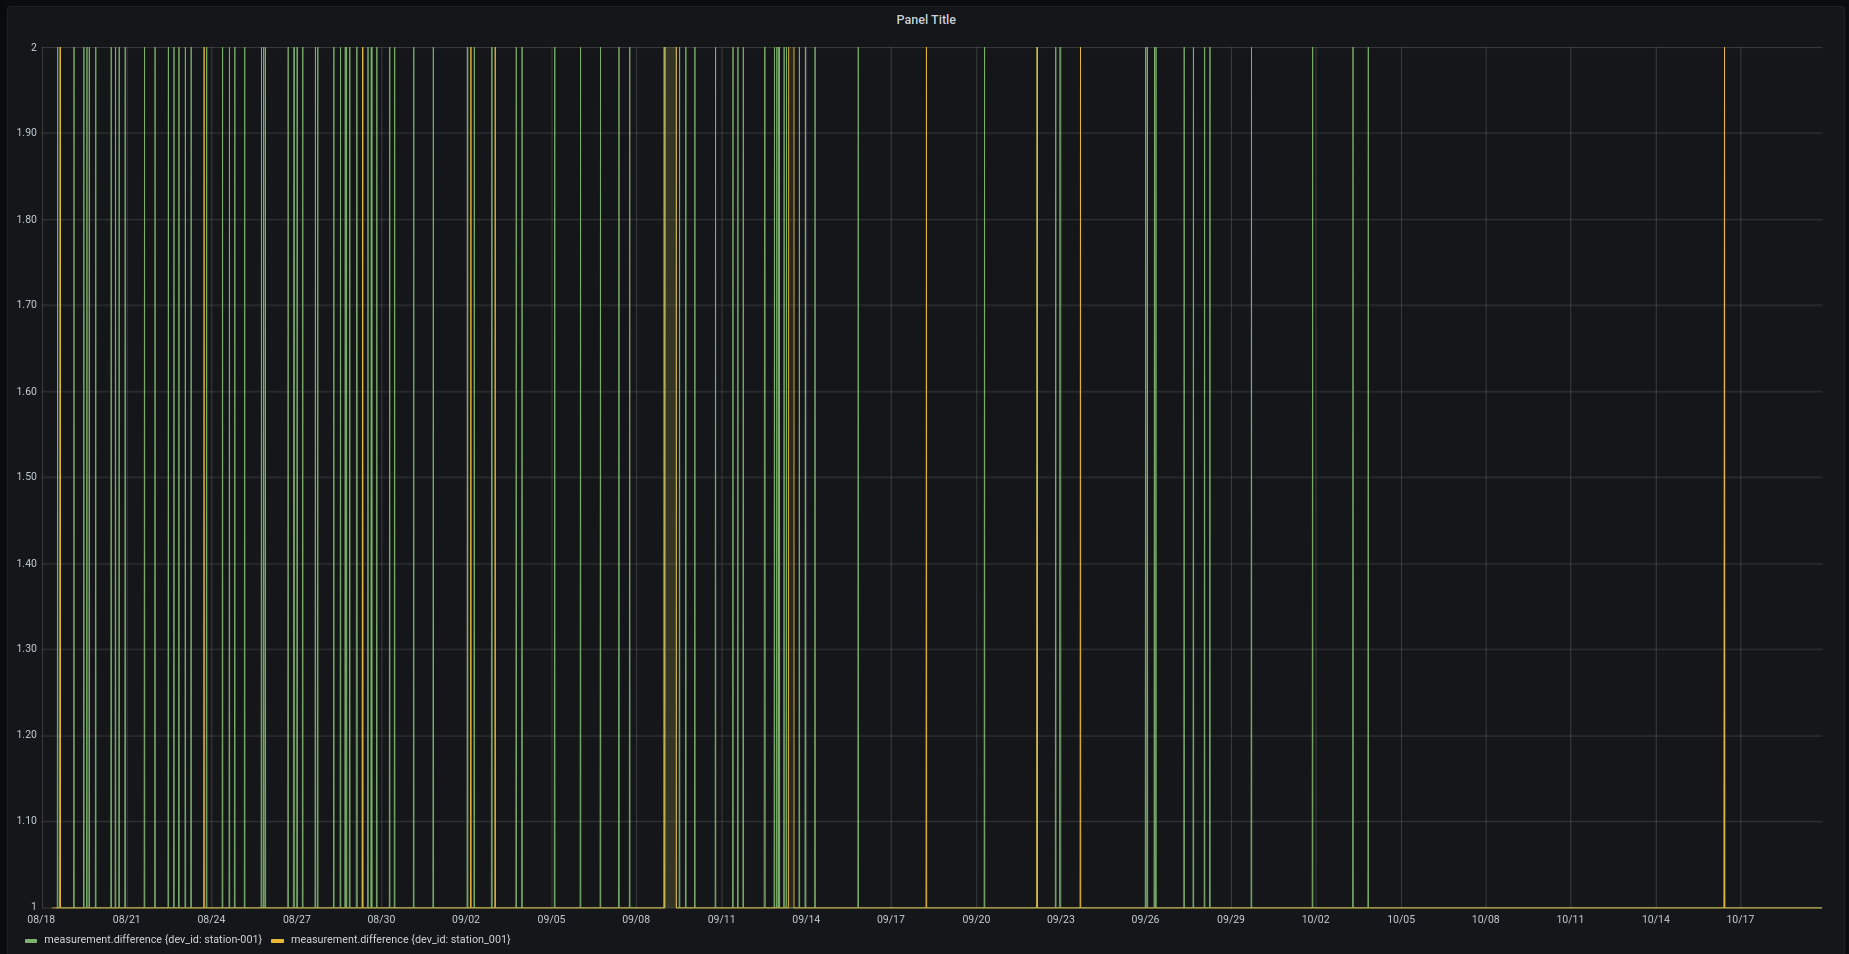
Since the evening of 2021-10-03 I have experienced less packet loss.

In this graph green is V3 and yellow is V2, same physical device delivering data to both, while the session is still active on V2.
image

Frame counters for this device as CSV is here. station-001=V3, station_01=V2.
undefined means packet was lost.
Explore-data-as-seriestocolumns-2021-10-19 20_51_55.csv.txt (215.7 KB)