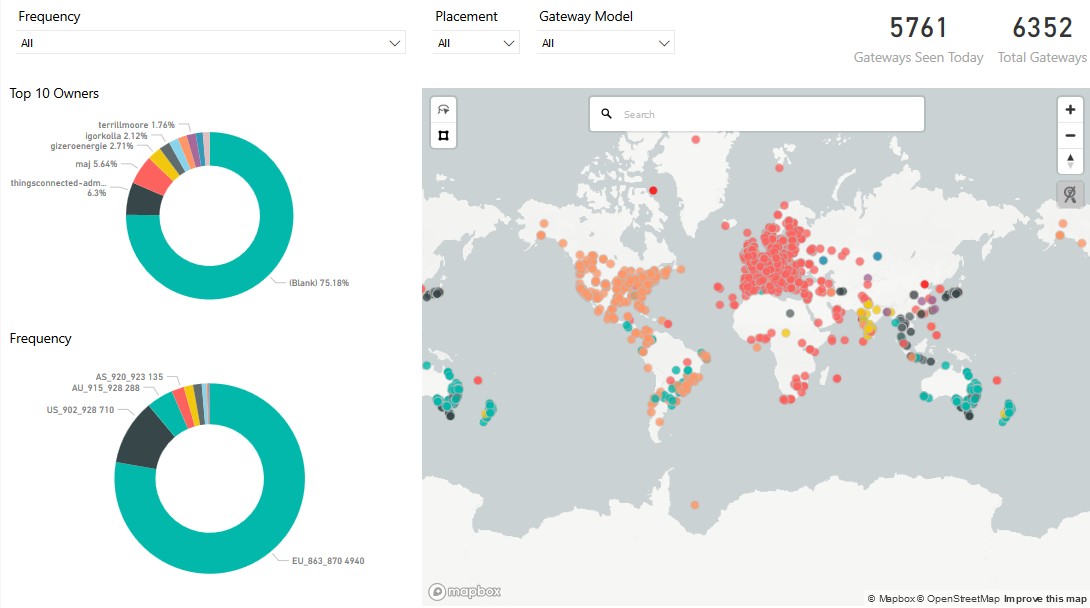
@AdamJP smacked together a map of the TTN gateways that are online/offline atm (going by the NOC server and the gateway data), it’s helpful to us in Australia as there seems to be multiple frequencies kicking around, may also be helpful for others planning deployments of things.
@AdamJP Looking nice however far from compete yet. I presume that data shall be updated and made more complete over time. In our community primary gateways are missing on the actual map. Keep up the good work!
Hey @pe1mew cheers, which ones are missing, I may be filtering the data differently to the TTN map, I think I’m filtering gateways that have been seen this month as a base.
I think there is a limit to how many points can be on the map at one time which is bugger … but also awesome nice work Europe!!. I’ll add another filter to filter by owner to see if your gateways come back.
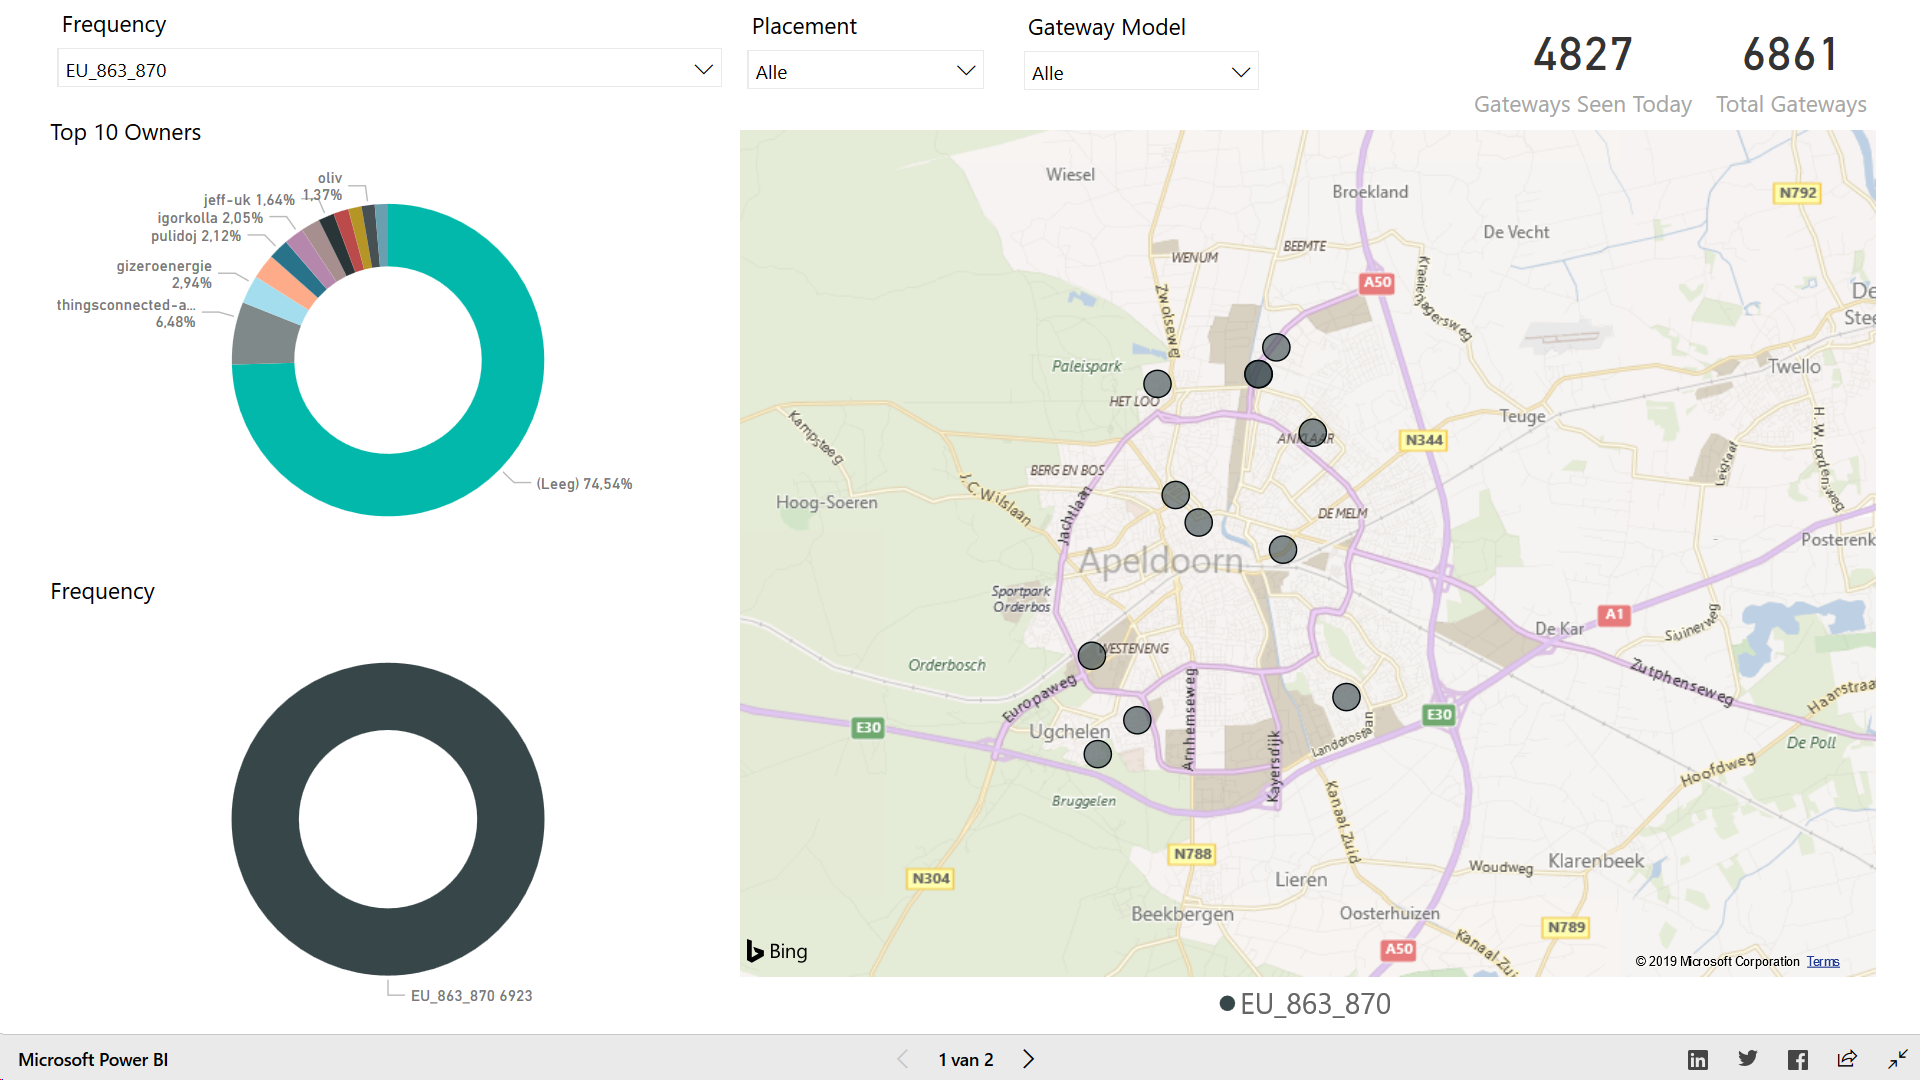
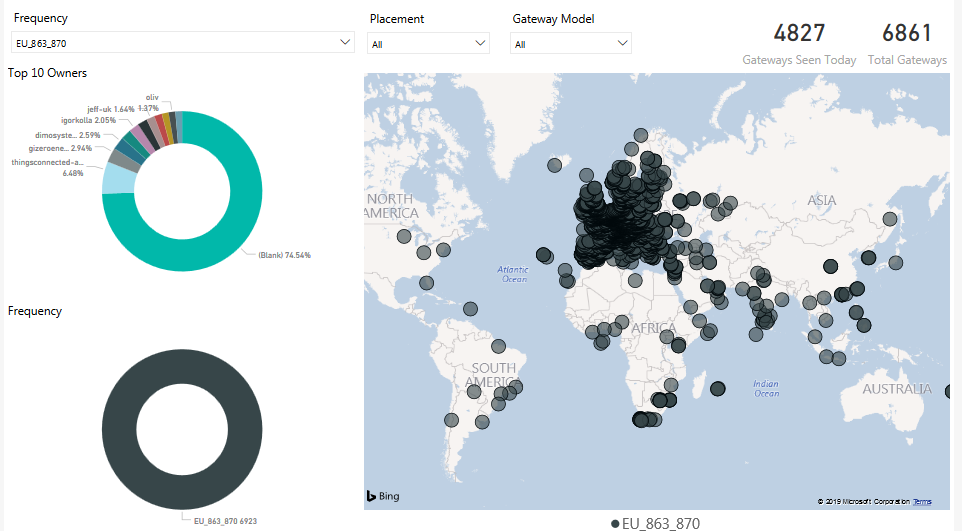
Can @pe1mew & @Jeff-UK please double check your gateways are on the map now, it was a limitation with the map control I think, was complaining about only a representative set of data was being displayed for the larger communities like Europe.
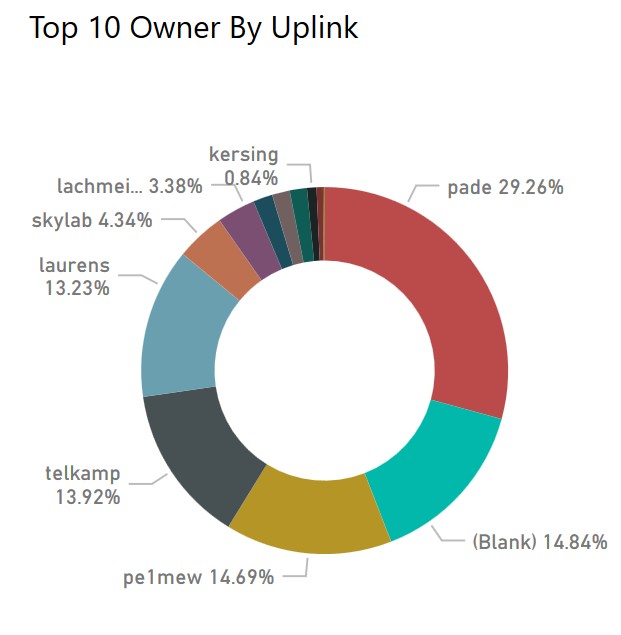
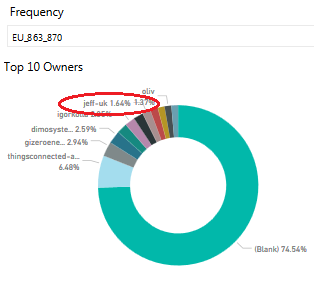
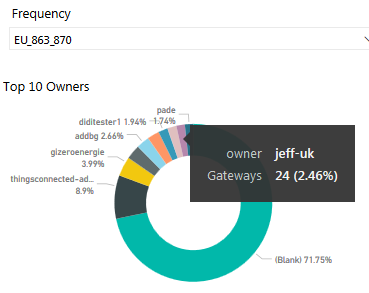
Hi Adam, I like the tool but from my 1st post I am doubtful wrt accuracy/scope. I was surprised my % showed so high. Since your changes I have checked again and it still correctly shows 24 GW’s registered under my user id - there are many more under various clients and other users but there are 25 registered under my own id with 1 currently down due to a long term failed solar power controller that should get replaced next week or so. With typically ~>500 GW’s operational in UK I ‘own’ ~5% of in country network…dashboard on map shows me around 2.4/2/5% of global EU_868 which seems way high as UK only a small part of total EU _868 deployment?
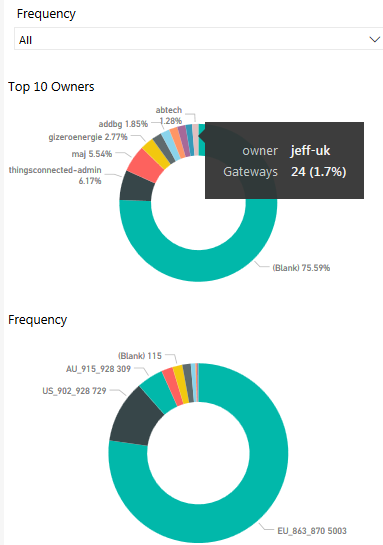
If I look at total TTN map and all freq it shows I have around 1.7% across all frequencies - again way high?
It’s great to have the 'bragging right’s but feels wrong at this time as suspect data is not reflecting all GW’s either globally or by freq band…
…what does does stand out is the sheer number of illegal GW’s operating around the world! - Wrong Freq in Wrong Territories - am sure not all of these are behind Faraday Cages in test labs
Hi Jeff, I like to see it as bragging rights for the TTN as the European network apart from a few is distributed as in there is not one entity that can take it away, 1.7% in comparison to the other 75% is a great figure to show that it is still a open network. Australia seems to be moving towards the evil side of network ownership which grinds my gears a little.
I have a peek through the numbers again and see if I can explain it in a different way.
Hi Adam, if I have 25 GW’s out of approx 6300 active then I would expect to see the share of all freq bands (total GW’s globally) as coming in ~0.4% so looks like the 1.7% attributed is some 4-4.5x too high If I have time tomorrow I may look at similar stats for some of the other larger contributors to see how their attributed percentage pans out as may point to systemic calc error somewhere…