I got a shock when I sliced by EU band globally:
Surely no way:
I got a shock when I sliced by EU band globally:
Surely no way:
Hi @AdamJP. I have looked in to it. I expected to see the following gateways but are not on the map:
I hope this helps.
Cu, Remko
Cheers, I’ll check it out today.
Update:
I think there is a limit to how many points can be on the map at one time which is bugger … but also awesome nice work Europe!!. I’ll add another filter to filter by owner to see if your gateways come back.
New Zealand has three bands in use… India868, AU915 and AS923
Haha but why?
Because each of the network operators thought there was good and better reaons to be different?
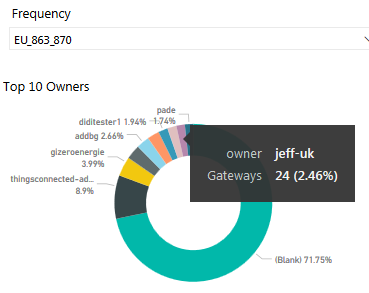
Can @pe1mew & @Jeff-UK please double check your gateways are on the map now, it was a limitation with the map control I think, was complaining about only a representative set of data was being displayed for the larger communities like Europe.
Cheers
Adam can you tell us something about how you build this, what tools / software / tricks ect 
Sure thing, built with Microsoft PowerBI as it supports web request for fetching JSON data eg: noc data from here: http://noc.thethingsnetwork.org:8085/api/v2/gateways
And the other gateway information is gathered from here: https://www.thethingsnetwork.org/gateway-data/
I cant remember why I had to get both but I think there was different data that I wanted from both, maybe frequency.
Cheers
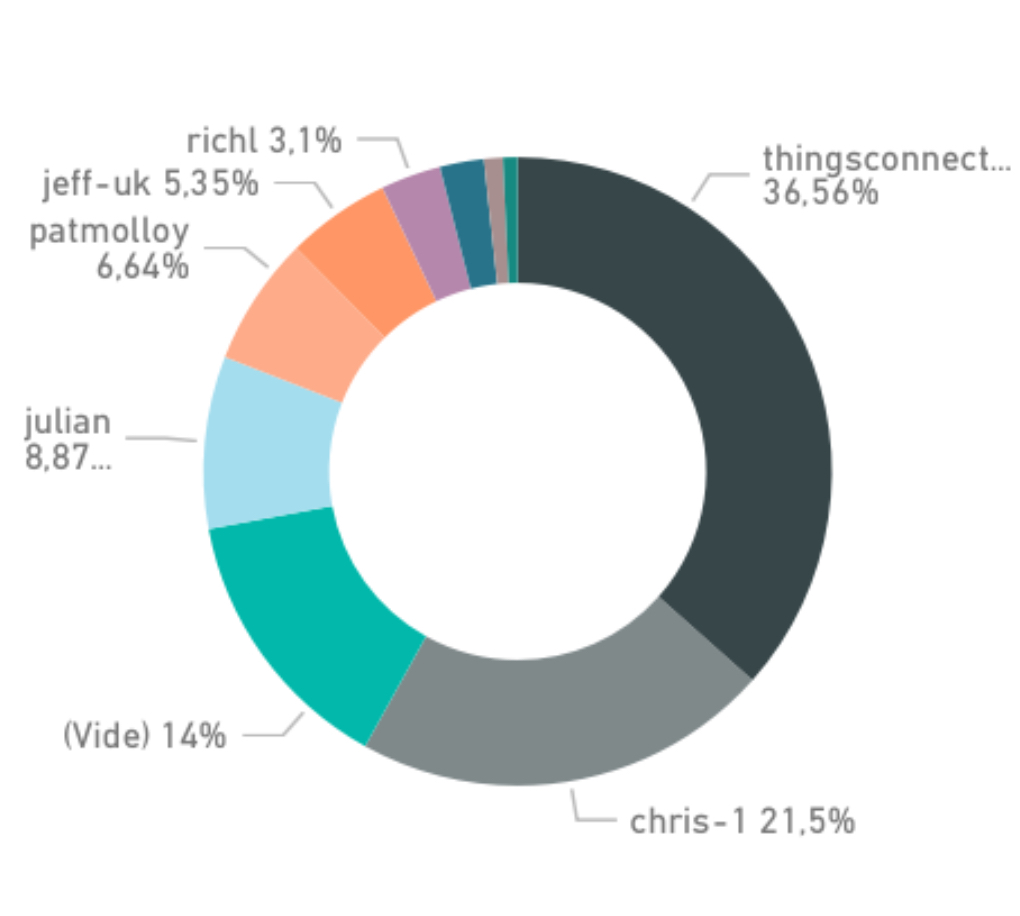
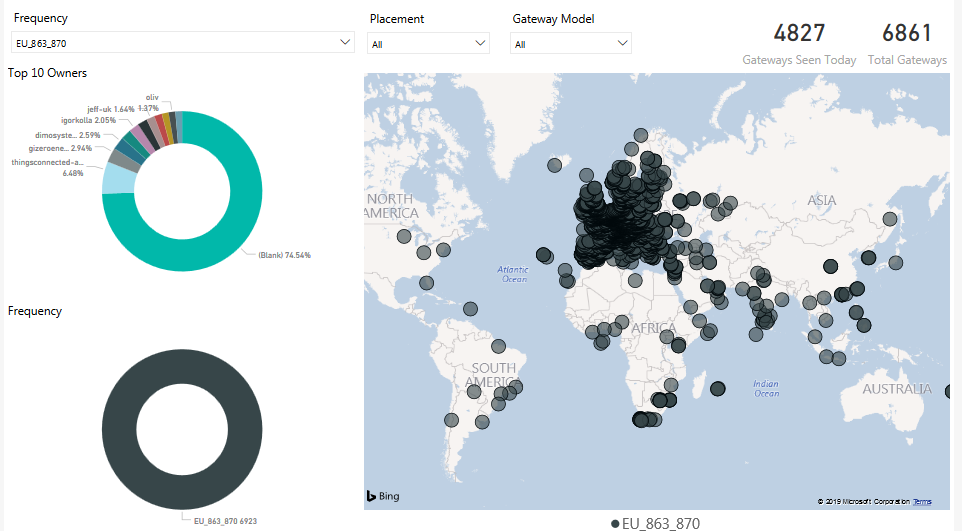
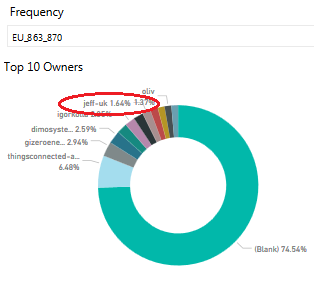
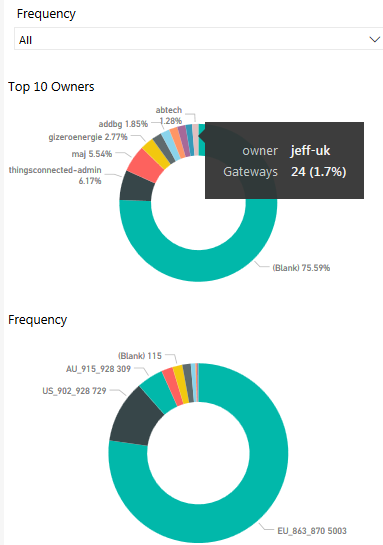
Hi Adam, I like the tool but from my 1st post I am doubtful wrt accuracy/scope. I was surprised my % showed so high. Since your changes I have checked again and it still correctly shows 24 GW’s registered under my user id - there are many more under various clients and other users but there are 25 registered under my own id with 1 currently down due to a long term failed solar power controller that should get replaced next week or so. With typically ~>500 GW’s operational in UK I ‘own’ ~5% of in country network…dashboard on map shows me around 2.4/2/5% of global EU_868 which seems way high as UK only a small part of total EU _868 deployment?
If I look at total TTN map and all freq it shows I have around 1.7% across all frequencies - again way high?
It’s great to have the 'bragging right’s but feels wrong at this time as suspect data is not reflecting all GW’s either globally or by freq band…
…what does does stand out is the sheer number of illegal GW’s operating around the world! - Wrong Freq in Wrong Territories - am sure not all of these are behind Faraday Cages in test labs 


Any chance for an option to slice by country?
Good job…please keep developing! 
Hi Jeff, I like to see it as bragging rights for the TTN as the European network apart from a few is distributed as in there is not one entity that can take it away, 1.7% in comparison to the other 75% is a great figure to show that it is still a open network. Australia seems to be moving towards the evil side of network ownership which grinds my gears a little.
I have a peek through the numbers again and see if I can explain it in a different way.
Cheers
Hi Adam, if I have 25 GW’s out of approx 6300 active then I would expect to see the share of all freq bands (total GW’s globally) as coming in ~0.4% so looks like the 1.7% attributed is some 4-4.5x too high If I have time tomorrow I may look at similar stats for some of the other larger contributors to see how their attributed percentage pans out as may point to systemic calc error somewhere…
How so? Whats going on that makes it evil?
You can, on page 2:
Also note that as far as I can see there is no timeframe on this: it is the total number of packets since day one.
Hey mate, not so much evil but the distribution of gateways is different to the larger communities as in a minority hold the ownership of the gateways in AU, so it’s up to them to determine the fate of the lorawan infrastructure, hopefully they have the similar values of the TTN.
@Jeff-UK That list is a top 10 list, the percentage value is based on the top 10, I can increase the N to lower the percentage of each but then it’s just confusing to read, there’s a lot of people that wouldn’t be on that list that own above 5 even 10 gateways.
I’ve added another page of the gateway ownership.
Cheers
Yep from the day the gateways were turned on to now, was the only count in the JSON data.
When I looked IIRC page 2 was a breakdown by upload msgs not # of GW’s…will look again when back at pc.
Right – my bad
Ah! 1.7% of the top 10…get it…but that will always be dominated by (Blank) which is similar to the long tail of smaller GW count owners (which as you say is not shown)…often users with just one or two leave as blank or anyone I guess setting the GW privacy settings to limit disclosure… 
Interesting, The same thing is likely to happen here in NZ, not becuase anyones evil, but simply becuase one group is going to fund a bunch of gateways very quickly.