I will be a Milesight temperature and humidity sensor, for collecting my data, this will connect to my local TTN Community gateways. In TTN Community we create an application and publish it to MQTT.
Node-RED will be deployed in AWS, where MQTT will receive the payload from TTN application. Data will be stored in an InfluxDB and display that in Grafana graph embedded in Node-Red dashboard.
-
AWS Account and Services
1.1. Head over to AWS and create a free account
1.2. Follow the tutorials and create an EC2 Ubuntu Server 18.04 LTS (HVM), SSD Volume t2.micro (free tier eligible), please check if you qualify for free tier.
1.3. Availability zone needs to be picked with care, TTN are deployed in 3 different clusters. In my instance eu1.cloud.thethings.network is the close to me. So I have a trade off with latency between where I am in the world, where my EC2 resides and TTN clusters.
1.4. Make sure you enable under your security the following ports: 3306, 3000, 1880. Care should be taken when you set your security and opening ports.
2. Node-RED setup on AWS
2.1. Head over to Node-Red here they have also so information on AWS and Node-RED. Please note that we are working with Ubuntu so follow those instructions.
2.2. Please remember to set that Node-RED to auto start up if and when you’re EC2 reboots (Please test this).
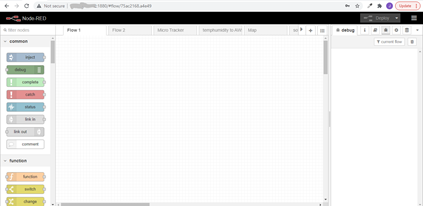
2.3. Once your Node-RED is up and running you can access the editor via http://:1880/
3. Grafana setup in AWS
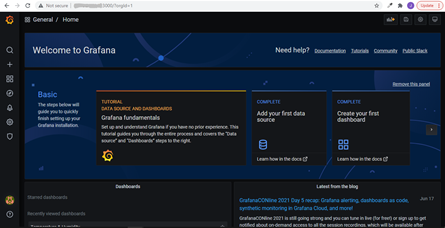
3.1. Head over to Grafana and follow there tutorial on the installation.
3.2. Please remember to set that Grafana auto start up if and when you EC2 reboots (Please test this)
3.3. Once your Grafana is up and running you can access via http://:3000/
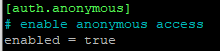
3.4. Chang the following setting in your /etc/grafana/grafana.ini,
[security] allow_embedding = true and [auth.anonymous]# enable anonymous access enabled = true, you need to reboot Grafana for the settings to take effect
![]()
4. InfluxDB setup in AWS
4.1. Head over to InfluxDB and follow the installation steps to install it.
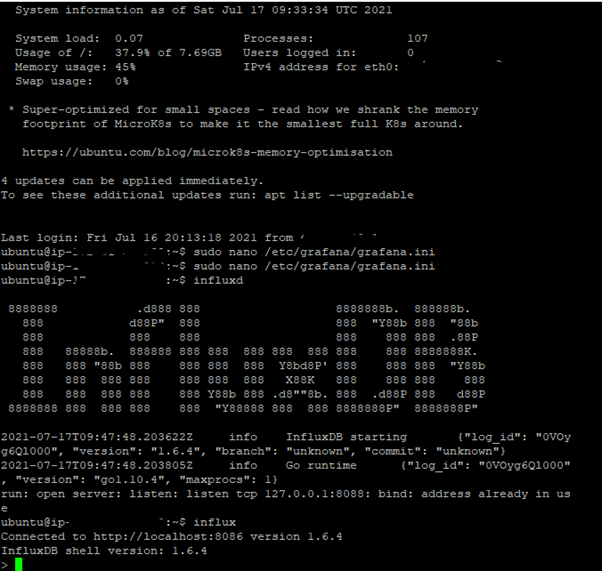
4.2. Log into your EC2 instance via Putty (or Tera Term).
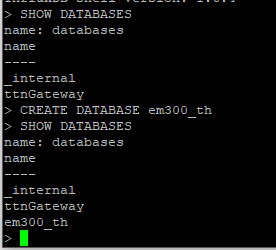
4.3. Run “influxd” to start InfluxDB and then “influx” to enter the CLI of Influx DB
4.4. Then run “CREATE DATABASE em300_th” to create your database.
4.5. Run “SHOW DATABASE” this will display all running databases.
4.6. Access the database “USE em300_th”
4.7. Add a user “CREATE USER admin WITH PASSWORD ‘password’ WITH ALL PRIVILEGES
5. TTN application
5.1. Head over to the The Things Network, you should have an account by now, if not create one.
5.2. Open the Consol.
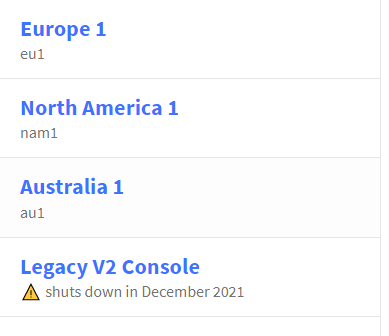
5.3. Here is a trade-off (or at least for me), the latency between me and any of the clusters are 200ms plus. So you can either latency between your AWS instance and the cluster, or latency between you and your AWS instance.
Select the cluster where you want to deploy you application.
5.4. Select “Go to Application”.
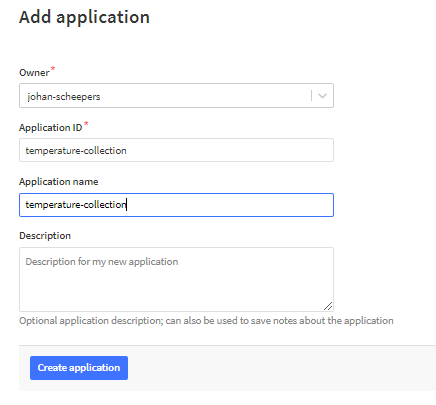
5.5. Select “Add Application”.

Fill in the “Application ID” and “Application name”, they need to be unique, I just called mine “temperature-collection”, then select “Create application”.
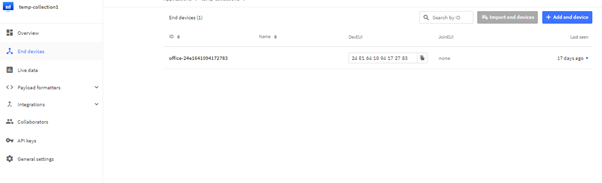
5.7 Select “End device” and “+ Add End Device”
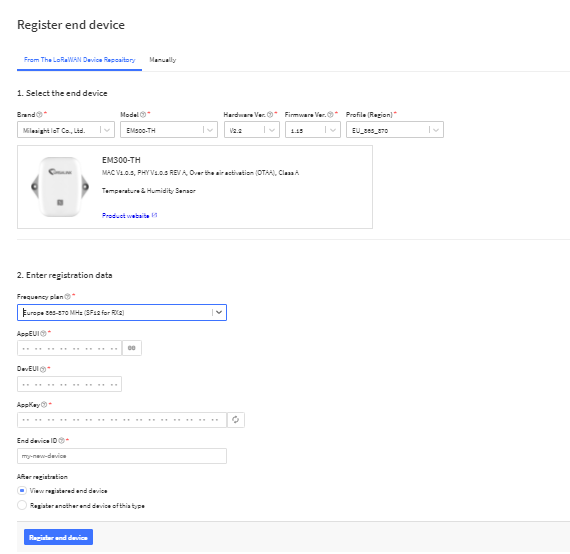
5.8 Select the “Brand”, “Model” and “Profile”, I am using a Milesight EM300-TH and EU863_870 (But this depends on you region.
Also complete the fields ‘AppEui”, “DevEUI”, “AppKey” and “End device ID”, the first 3 fields com with your device the last one “End device ID” is so that you can identify you device easily.
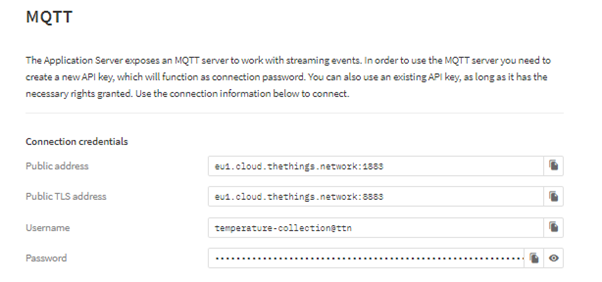
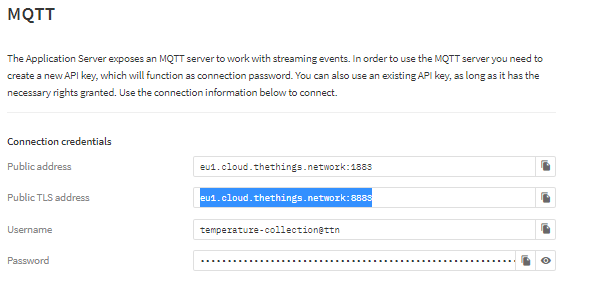
5.9 Select “Integration” and the “MQTT”. Copy the Username and then select the “Generate new API key” and copy this “Password”, store both in a safe place, we are going to require them in Node-RED “MQTT In” node.
6. Node-RED in AWS setting up MQTT and connection to InfluxDB
6.1 Now open as in Step 2.3 http://:1880/
6.2 Drag and drop an “mqtt in” node on the pallet
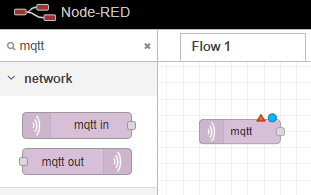
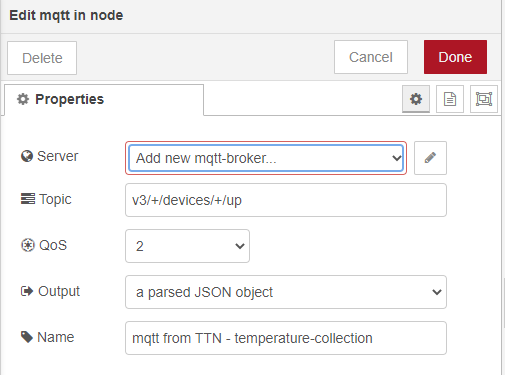
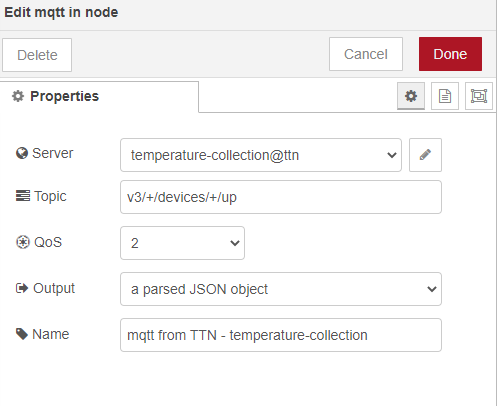
6.3 Double click on the ‘mqtt node”, it will pop open. Set Topic to “v3/+/devices/+/up”, “Output” to “a parsed JSON object” and “Name” to “mqtt from TTN - temperature-collection”. Then select the “pencil” icon by “Server”.
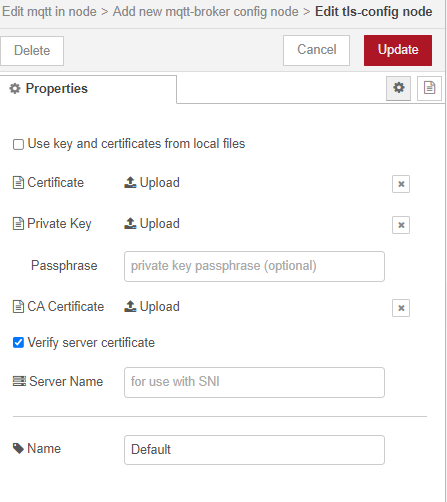
6.4 Set “Server” to “eu1.cloud.thethings.network” from the TTN integration mqtt page and the “Port” to 8883. Select “Enable secure (SSL/TTL) connection and click on the pencil icon.
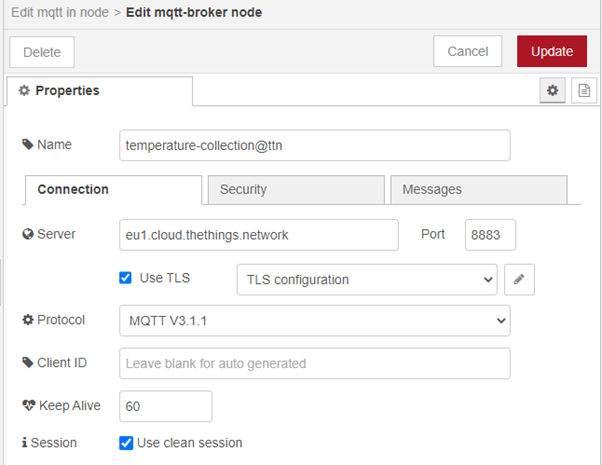
6.5 Just select “Update” and leave the rest default.
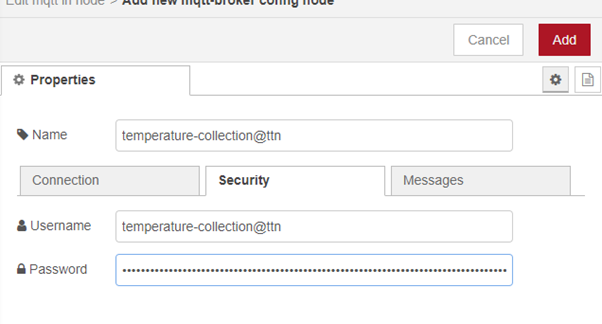
6.6 Enter your “Username” and “Password” from step 5.9 and select “Add”
6.7 Select “Done”
6.8 Add a “debug” node and wire it to the “mqtt in”
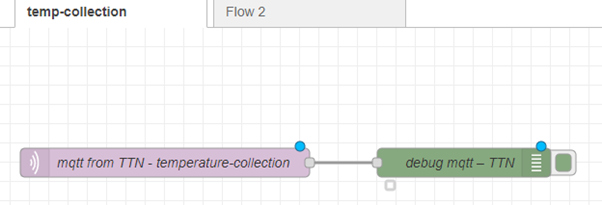
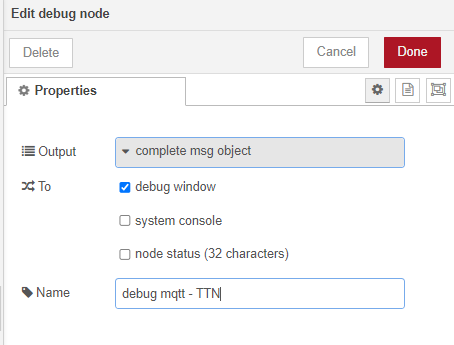
6.9 Double click on the “debug” node and set “Output” to “complete msg object” and “Name” it “debug mqtt – TTN”. Select “Done”
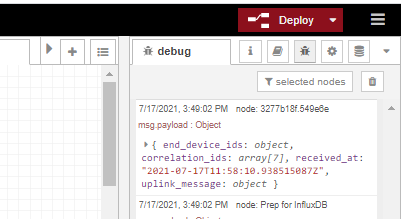
6.10 Add a “function” node and wire it to the “mqtt in” node and a “debug” node wired to the “function” node rename the “Function node as “Prep for InfluxDB”. And the following code to the node and select “Done”
let eui = msg.payload.end_device_ids.device_id;
let temperature = msg.payload.uplink_message.decoded_payload.temperature;
let humidity = msg.payload.uplink_message.decoded_payload.humidity;


msg = {}


msg.payload = {
    eui: eui,
    temperature: temperature,
    humidity: humidity

}

return msg
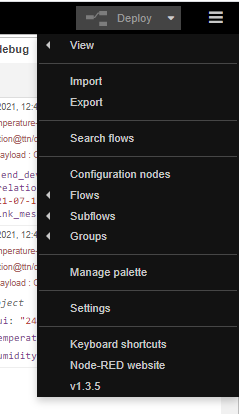
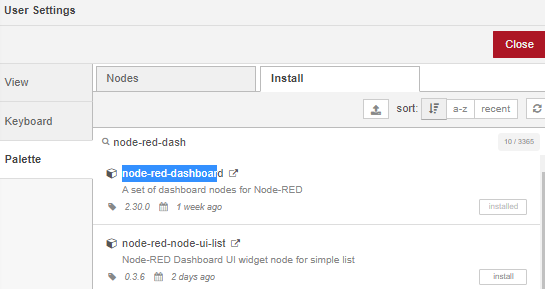
6.10 Add the additional nodes to you Node-Red, select the “Hanuger” button in the top right a dselect “Manage Pallet”
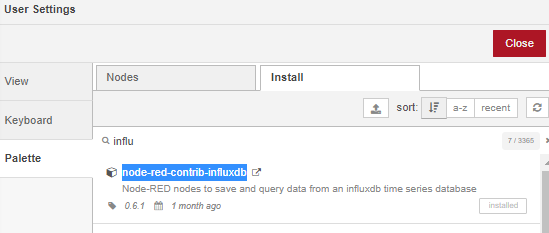
6.11 Add the following two node collection “node-red-contrib-influxdb” and “node-red-dashboard” by searching for each one and press the “install” button, as you can see bot mine are installed
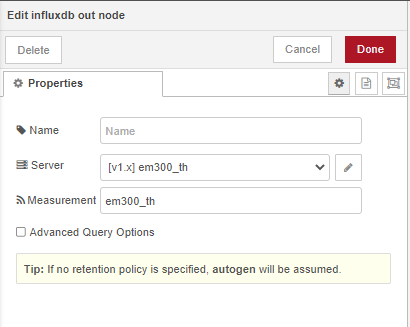
6.12 Add an “influxdb out” node and wire the output of “Prep for InfluxDB”.
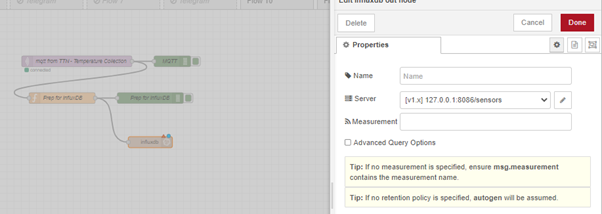
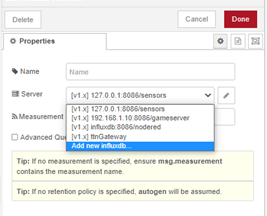
6.13 Select the “Pen” button and “Add new influxdb…”
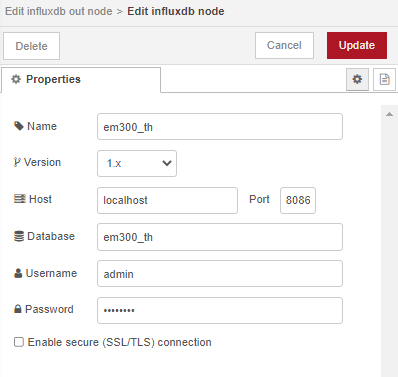
6.14 Add now the properties of the database created in step 4.4 and 4.7 and select “Update”
6.15 Add “measurement” “em300_th” and select “Done”
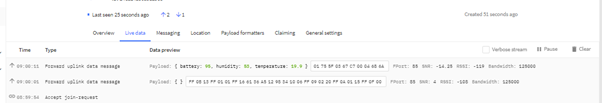
6.16 Select deploy and the next Uplink will be written to you InfluxDB.
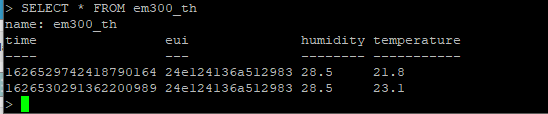
6.17 In you Putty connected to you EC2 and running influxdb, “SELECT * FROM em300_th”
7. Grafana
7.1 Access Grafana via http://:3000/
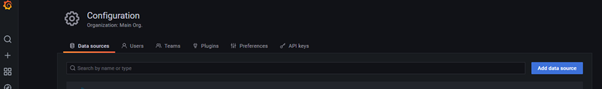
7.2 Select “Data source”
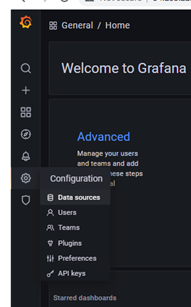
7.3 Select “Add data source”
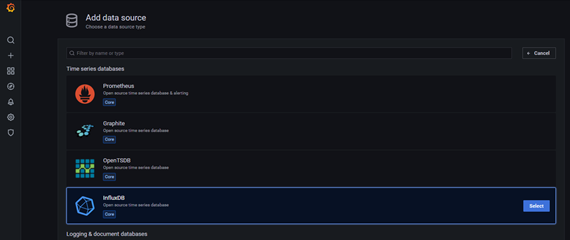
7.4 Select “InfluxDB”
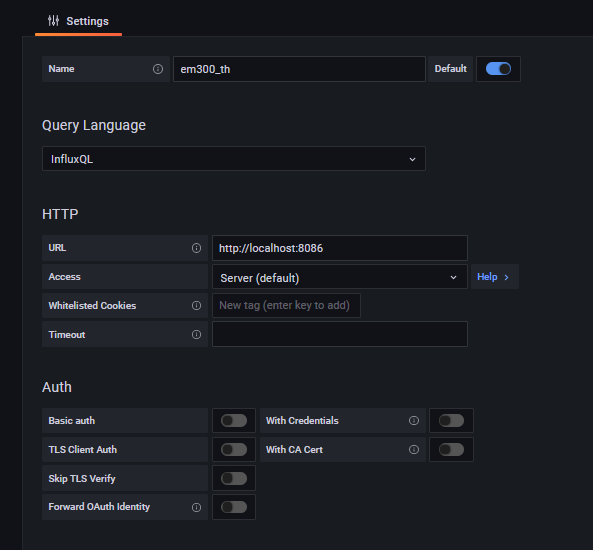
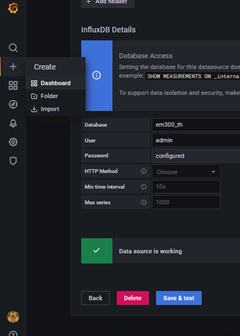
7.5 Set you InfluxDB credentials up as created in step 4.4 and 4.7, and select “Default”
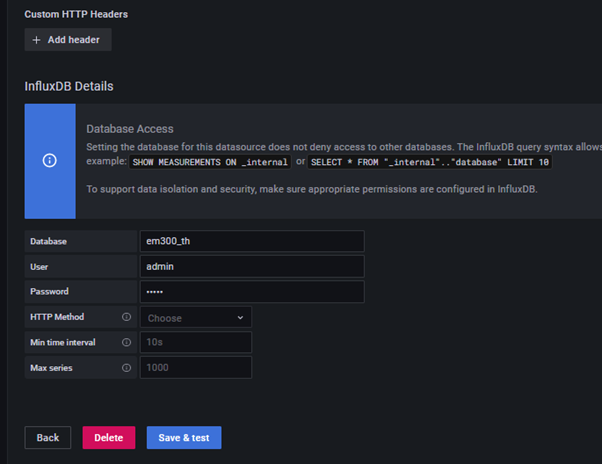
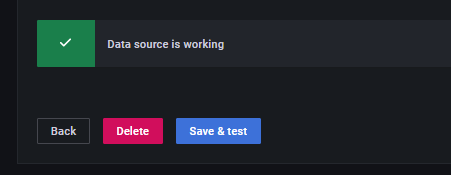
7.6 Select “Save & test” any you should get back “Data source is working”
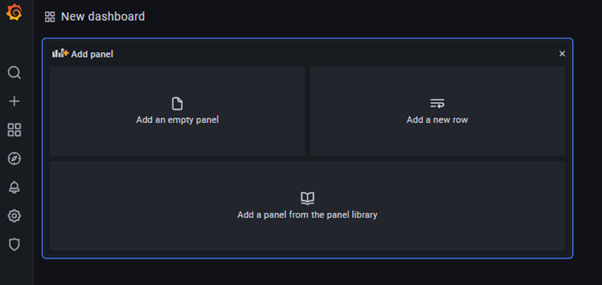
7.7 Select “Dashboard”
7.8 Select “Add an empty panel”
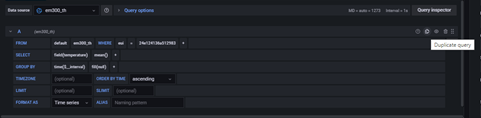
7.9 Edit the query panel to select the data for your node.
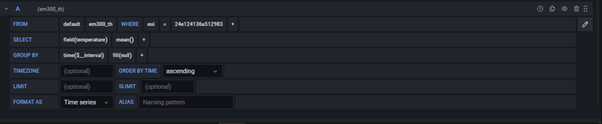
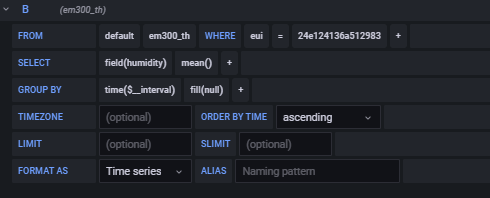
7.10 Add a second query panel selecting “Duplicate query”
7.11 You now only need to edit the “SELECT”
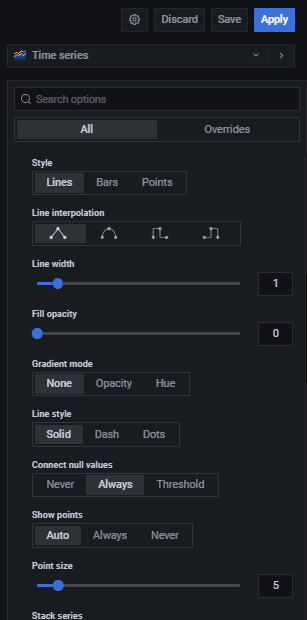
7.12 Select “Connect null values” and “Apply”
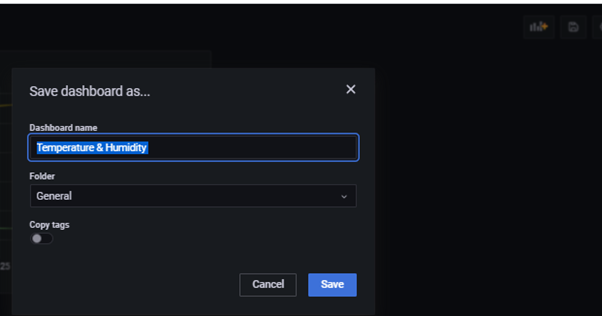
7.13 Select “Save” and name you dashboard
7.14 You can just use Grafana to monitor your devices, but I am going to embed this panel in Node-Red dashboard as there are other functionality I want to use in Node-Red
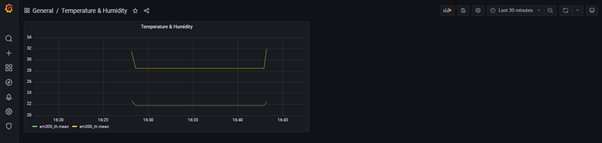
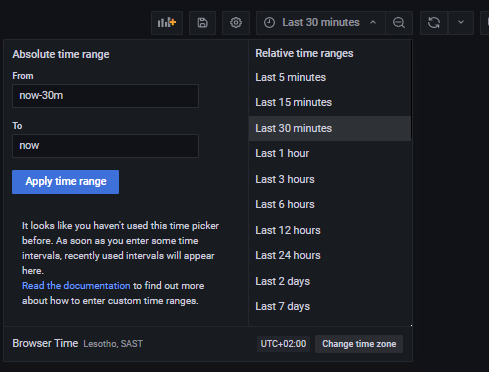
You can also play around with the time range and Refresh Dashboard settings
7.15 Go to “Home and select “Share”
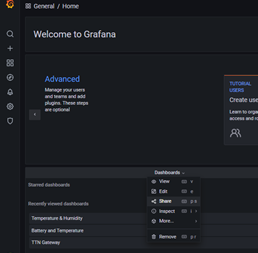
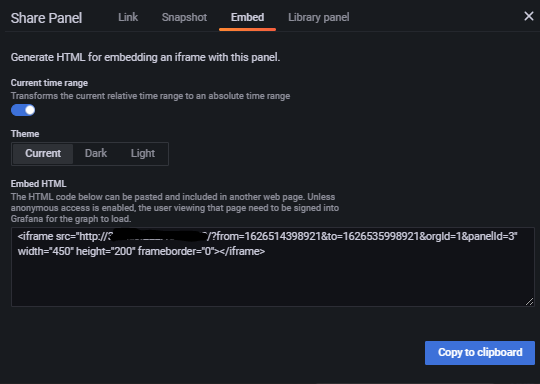
7.15 On the “Share Panel” select “Embed” and “Copy to clipboard” , we will use this in Node-Red
8. Emending Grafana in Node-Red
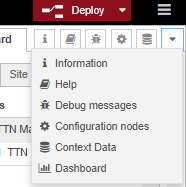
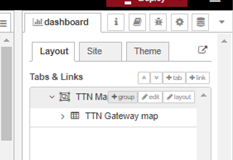
8.1 Go back to your Node-Red http://:1880/ and select the Dashboard
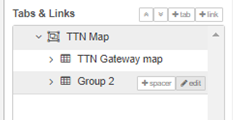
8.2 Select “+group”
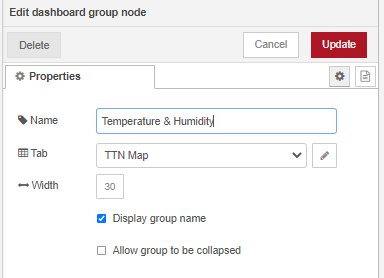
8.3 Select “edit” of the Group
8.4 Edit the Name and the width of the group and select “Update”
8.5 Drag and drop a “template” node onto you flow.
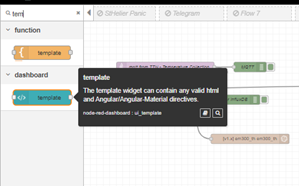
8.6 Open up the ‘template” node and edit “Group” , “Size” and past the Embedded HLMT form step 7.15.
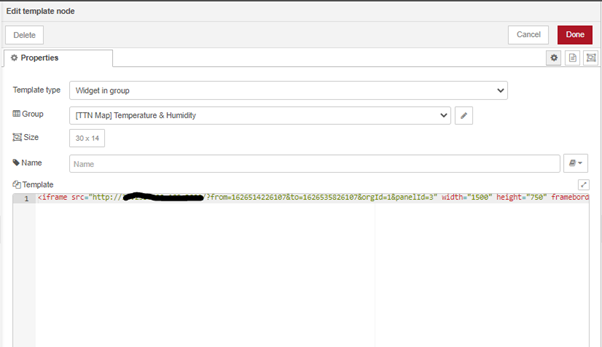
8.7 You will need to adjust the “Size” and “width=“1500” height=“750”” setting to suit your screen size, select “Done”
8.8 Deploy your flow and select the arrow button, this will launch your Node-red Dashboard.
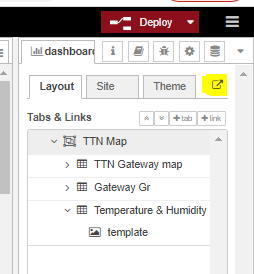
8.9 With luck you will now have Grafana embedded in your Node-Red dashboard.