New Application V3 OTAA not working

Hi,
I was very motivated trying the V3 stack so I registered my first device / application yesterday. Unfortunately its not working.
I used a (new and unused) Dragino waterleak sensor (LWL01 -- LoRaWAN Water Leak) and I think I set everything correctly.
Keys double checked, Lorawan Version 1.0.3, Class A, join server default (things network).

As You can see in this screenshot of the Gateway (V2), there is no green join accept on the gateway side, but it seems the join is ok, since it got a TTN device address and starts sending messages. It sends 8 times (7 retrys) the same Message. I guess retrying beause there is no answer from the gateway?

gateway join fail v2

Looking closer at this first data message:

nobrokers v2 fail

It seems not to be forwarded to anywhere, but in the V3 Application livedata I see: the first message arrived in the application, and only the first, not the other 7. (Dont mind the different timestamps, screenshots from different connectiontest but same behaviour) It scedules the ADR request downlink and nothing more happens.
The join seems also fine on the application livedata (sorry no screenshots).

received

To make sure its not a problem with the sensortype I´ve not used bevore I registered the same devicetype (not the same device) to an new V2 application and it works just as expected. Joining (with green join accept), sending data messages just once, getting sort of ACK by the gateway (I guess with ADR request) and lowering TX SF to 9 in steps of 1 SF per message.

gateway join sucess v2

So I think the problem with the V3 application might be the missing downlink which seems to not be sent. And also I´m worried about the missing green join accept in the gateway console, but I don´t know if thats a problem, since the join seems to work.

The gateway view in v2 will not show downlinks sent through Packet Broker. From the fact that the device starts sending messages, you can indeed conclude that the join was accepted.

That does suggest that at least uplinks are routed correctly, so that’s good. The ordering of those events you see in the v3 console seems to be a bit off, but it does look like a downlink with ADR and Device Status MAC commands is scheduled (right, @roman?).

Do you by any chance have logs from your gateway to confirm this?

Yeah don’t worry about that.

Also, in case we need to look into this a bit deeper, we could really use some more details about your device and gateway:

  • Gateway EUI and/or ID
  • Device AppEUI/JoinEUI and DevEUI
  • DevAddrs (there will be multiple)
  • Rough timestamps

I don´t have gateway logs.
Even while the downlinks are (generally) not shown in the gateway console (V2) because of the packet broker, I still thought they were not even sent because they should appear in the V3 application data as someting like “successfully sent” and not just “scheduled” and “enqueued”?

Another thing I was thinking of, if other timing of the RX windows in V3 might cause this issue, but Johan told in the chat the windows in OTAA are beeing automatically negotiated with the join, so this likely will not be the case.

If it woult help I could make someone of You a collaborator of the application and trigger an rejoin or datamessage.

Gateway eui: multi-gateway-oberfoehring
App eui: A000000000000107
Dev eui: A8404183F182601B
DevAddr: 26 0B 04 91 (yesterday 26.01.2021 at 18:32:16 CET)
DevAddr: 26 0B 6D 93 (right now)

Timestamp of the first datamessage after join yesterday 26.01.2021 at 18:32:16 CET

I deleted the application and registered it again to make sure I haven´t changed any default settings, but its all the same. (before the first post)

I was willing to test V3 stack, so the on 26 january, at evening, I registered the gateway (Laird RG186 - build gatwick-laird-93.8.5.25) and a new application for an end device (Arduino MKR WAN 1300 + one the Arduino scripts from their LoRaWAN library).
I used UDP forwarder.
OTAA authetication went OK.
January 27 I tried to use Basic station with CUPS and arrived after a while to connect.
When I tried to make a downlink from the console I started to have problems.
I than power cycled the end device to force a rejoin, but it didn’t arrive to rejoin.
Switched back, just to try, to UDP forwarder with same results.
I also made a reboot of the gateway.

join request are logged in the console, as well as join accept, … but fails always join schedule the join accept.

Is it active the fair use policy for downlinks also for OTAA join accept downlinks ?
note: I had already used the same gateway in TTN v2 (with UDP forwarder).

Gateway ID: blu-gtw-001

Device EUI: A8610A3039426705
Join EUI: 0000000000000000
Dev Address: 260B23E5
Dev address accept join request: 260B3411

This is part of RG186 gateway log:

G1xx293BEE php-cgi user.info Jan 28 01:15:13 lrd-sdk: LRD_WF_GetSSID():2991 returned SDCERR_FAIL
RG1xx293BEE php-cgi user.info Jan 28 01:15:08 lrd-sdk: LRD_WF_GetSSID():2991 returned SDCERR_FAIL
RG1xx293BEE lora user.notice Jan 28 01:15:07 INFO: Disabling GPS mode for concentrator’s counter…
RG1xx293BEE lora user.notice Jan 28 01:15:07 JSON up: {“rxpk”:[{“tmst”:1646325779,“chan”:1,“rfch”:1,“freq”:868.300000,“stat”:1,“modu”:“LORA”,“datr”:“SF7BW125”,“codr”:“4/5”,“lsnr”:10.2,“rssi”:-41,“size”:23,“data”:“AAAAAAAAAAAABWdCOTAKYagMBuwC7NM=”}]}
RG1xx293BEE lora user.notice Jan 28 01:15:07 INFO: Received pkt from mote: 00000000 (fcnt=0)
RG1xx293BEE lora user.notice Jan 28 01:15:07 INFO: [down] PULL_ACK received in 98 ms
RG1xx293BEE lora user.notice Jan 28 01:15:07 JSON up: {“rxpk”:[{“tmst”:1639275883,“chan”:2,“rfch”:1,“freq”:868.500000,“stat”:1,“modu”:“LORA”,“datr”:“SF7BW125”,“codr”:“4/5”,“lsnr”:6.5,“rssi”:-43,“size”:23,“data”:“AAAAAAAAAAAABWdCOTAKYagUnec70tc=”}]}
RG1xx293BEE lora user.notice Jan 28 01:15:07 INFO: Received pkt from mote: 00000000 (fcnt=0)
RG1xx293BEE lora user.notice Jan 28 01:15:07 INFO: [down] PULL_ACK received in 153 ms
RG1xx293BEE lora user.notice Jan 28 01:15:07 JSON up: {“rxpk”:[{“tmst”:1632226003,“chan”:1,“rfch”:1,“freq”:868.300000,“stat”:1,“modu”:“LORA”,“datr”:“SF7BW125”,“codr”:“4/5”,“lsnr”:10.8,“rssi”:-42,“size”:23,“data”:“AAAAAAAAAAAABWdCOTAKYai4rj0p6o8=”}]}
RG1xx293BEE lora user.notice Jan 28 01:15:07 INFO: Received pkt from mote: 00000000 (fcnt=0)
RG1xx293BEE lora user.notice Jan 28 01:15:07 INFO: [down] PULL_ACK received in 94 ms
RG1xx293BEE lora user.notice Jan 28 01:15:07 JSON up: {“rxpk”:[{“tmst”:1625176107,“chan”:2,“rfch”:1,“freq”:868.500000,“stat”:1,“modu”:“LORA”,“datr”:“SF7BW125”,“codr”:“4/5”,“lsnr”:6.8,“rssi”:-39,“size”:23,“data”:“AAAAAAAAAAAABWdCOTAKYaifx8TptpM=”}]}
RG1xx293BEE lora user.notice Jan 28 01:15:07 INFO: Received pkt from mote: 00000000 (fcnt=0)
RG1xx293BEE lora user.notice Jan 28 01:15:07 JSON up: {“stat”:{“time”:“2021-01-28 01:14:38 GMT”,“rxnb”:3,“rxok”:3,“rxfw”:3,“ackr”:0.0,“dwnb”:0,“txnb”:0}}
RG1xx293BEE lora user.notice Jan 28 01:15:07 ##### END #####
RG1xx293BEE lora user.notice Jan 28 01:15:07 # GPS sync is disabled
RG1xx293BEE lora user.notice Jan 28 01:15:07 ### [GPS] ###
RG1xx293BEE lora user.notice Jan 28 01:15:07 src/jitqueue.c:448:jit_print_queue(): INFO: [jit] queue is empty
RG1xx293BEE lora user.notice Jan 28 01:15:07 # SX1301 time (PPS): 1588849570
RG1xx293BEE lora user.notice Jan 28 01:15:07 ### [JIT] ###
RG1xx293BEE lora user.notice Jan 28 01:15:07 # BEACON rejected: 0
RG1xx293BEE lora user.notice Jan 28 01:15:07 # BEACON sent so far: 0
RG1xx293BEE lora user.notice Jan 28 01:15:07 # BEACON queued: 0
RG1xx293BEE lora user.notice Jan 28 01:15:07 # TX errors: 0
RG1xx293BEE lora user.notice Jan 28 01:15:07 # RF packets sent to concentrator: 0 (0 bytes)
RG1xx293BEE lora user.notice Jan 28 01:15:07 # PULL_RESP(onse) datagrams received: 0 (0 bytes)
RG1xx293BEE lora user.notice Jan 28 01:15:07 # PULL_DATA sent: 3 (100.00% acknowledged)
RG1xx293BEE lora user.notice Jan 28 01:15:07 ### [DOWNSTREAM] ###
RG1xx293BEE lora user.notice Jan 28 01:15:07 # PUSH_DATA acknowledged: 0.00%
RG1xx293BEE lora user.notice Jan 28 01:15:07 # PUSH_DATA datagrams sent: 4 (730 bytes)
RG1xx293BEE lora user.notice Jan 28 01:15:07 # RF packets forwarded: 3 (69 bytes)
RG1xx293BEE lora user.notice Jan 28 01:15:07 # CRC_OK: 100.00%, CRC_FAIL: 0.00%, NO_CRC: 0.00%
RG1xx293BEE lora user.notice Jan 28 01:15:07 # RF packets received by concentrator: 3
RG1xx293BEE lora user.notice Jan 28 01:15:07 ### [UPSTREAM] ###
RG1xx293BEE lora user.notice Jan 28 01:15:07 ##### 2021-01-28 01:14:38 GMT #####

Istantanea_2021-01-28_01-25-11

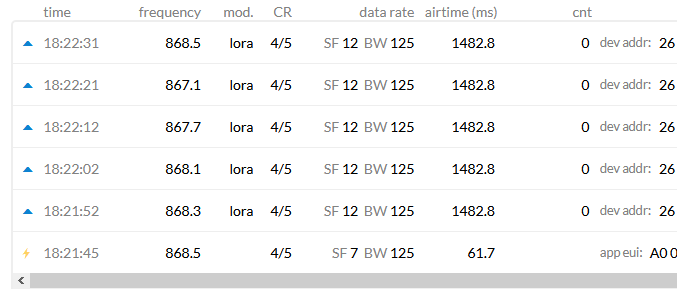
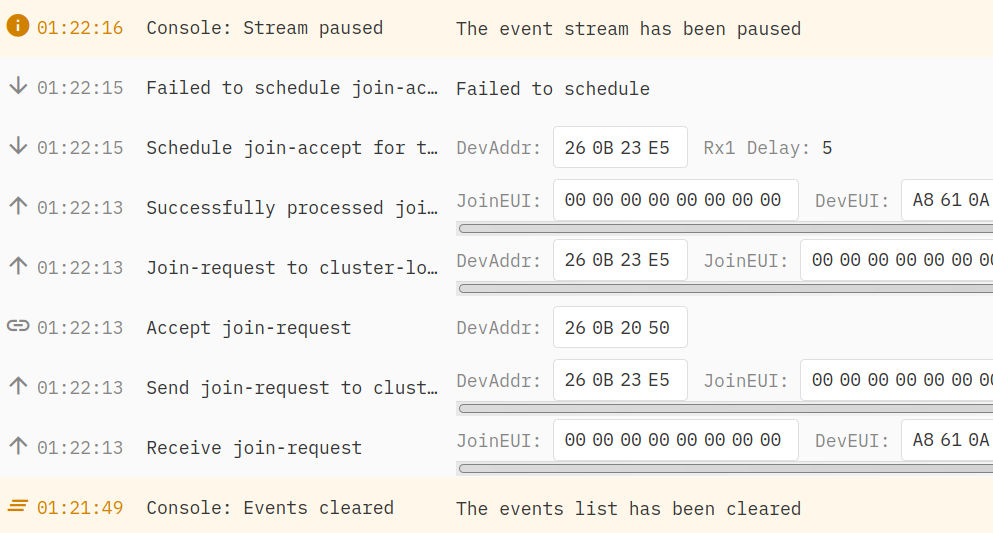
Today I tried to see what was the problem with “failed to schedule join-accept join” error.
So I looked in the json data that can be seen in live data.

{
“name”: “ns.down.join.schedule.fail”,
“time”: “2021-01-29T14:25:27.190686201Z”,
“identifiers”: [
{
“device_ids”: {
“device_id”: “mkr-wan-001”,
“application_ids”: {
“application_id”: “mkr-wan-13xx”
},
“dev_eui”: “A8610A3039426705”,
“join_eui”: “0000000000000000”,
“dev_addr”: “260B23E5”
}
}
],
“data”: {
“@type”: “type.googleapis.com/ttn.lorawan.v3.ErrorDetails”,
“namespace”: “pkg/gatewayserver”,
“name”: “schedule”,
“message_format”: “failed to schedule”,
“correlation_id”: “11a43244112e4505a3ea3f092041f15f”,
“code”: 10,
“details”: [
{
“@type”: “type.googleapis.com/ttn.lorawan.v3.ScheduleDownlinkErrorDetails”,
“path_errors”: [
{
“namespace”: “pkg/gatewayserver”,
“name”: “not_connected”,
“message_format”: “gateway {gateway_uid} not connected”,
“attributes”: {
“gateway_uid”: “blu-gtw-001@ttn”
},
“code”: 5
}
]
}
]
},
“correlation_ids”: [
“gs:conn:01EX7875FMWC41TCKD2A6Q4SRT”,
“gs:up:host:01EX7875FX7KMXQFRA47V5FHFX”,
“gs:uplink:01EX78HMAEGBSPENJN2240PR4F”,
“ns:downlink:01EX78HP4N9VPEC6ME1TWRH3A8”,
“ns:uplink:01EX78HMAFJ1KFKHP8QSJKDNX2”,
“rpc:/ttn.lorawan.v3.GsNs/HandleUplink:01EX78HMAFQ1VY0VFT49NDSAA1”
],
“origin”: “ip-10-100-14-196.eu-west-1.compute.internal”,
“context”: {
“tenant-id”: “CgN0dG4=”
},
“visibility”: {
“rights”: [
“RIGHT_APPLICATION_TRAFFIC_READ”
]

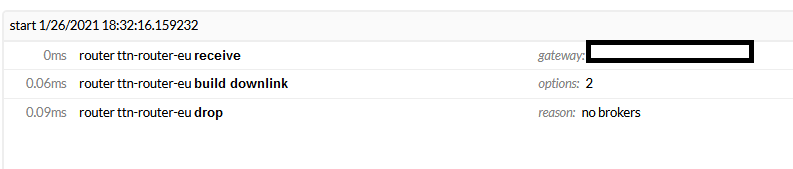
So the problem was that the gateway had a “not connected” status, even if was connected.
To remember that my first problem started because I tried a downlink message from console. That not worked, so making some tries including power cycle device to force a rejoin (without success), but also switching back from Basic Station to UDP forwarder.

It looks like that one switches from Basics Station CUPS to UDP forwarder there is something in v3 database that lets status to “not connected” in gateways management (but in console the gateway is marked as connected).

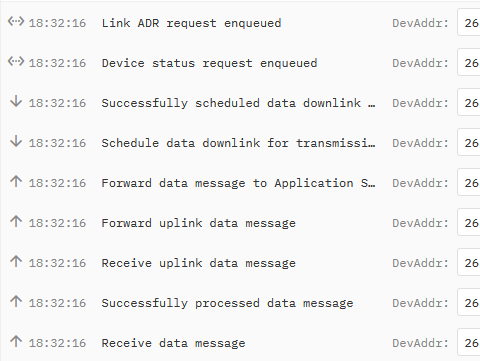
When I switched back Laird Rg186 to Basic Stations than the end device join had success.

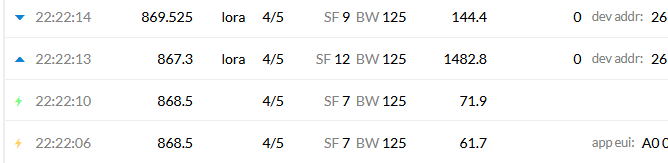
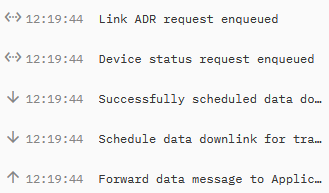
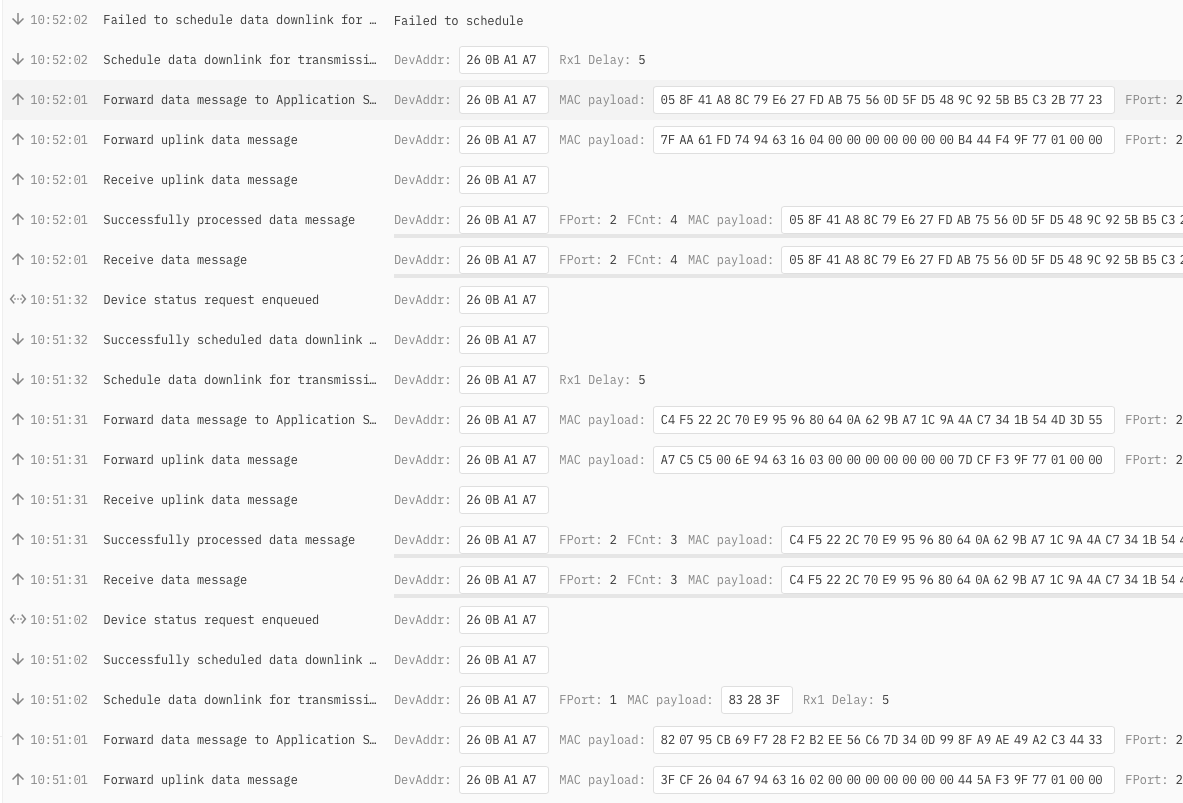
hat said I have always the problem with dowlinks, with always error for being “not connected”.

{
“name”: “ns.down.data.schedule.fail”,
“time”: “2021-01-29T15:02:08.307504705Z”,
“identifiers”: [
{
“device_ids”: {
“device_id”: “mkr-wan-001”,
“application_ids”: {
“application_id”: “mkr-wan-13xx”
},
“dev_eui”: “A8610A3039426705”,
“join_eui”: “0000000000000000”,
“dev_addr”: “260B725C”
}
}
],
“data”: {
“@type”: “type.googleapis.com/ttn.lorawan.v3.ErrorDetails”,
“namespace”: “pkg/gatewayserver”,
“name”: “schedule”,
“message_format”: “failed to schedule”,
“correlation_id”: “4e044e4ca07d488d8e41e52daaef695f”,
“code”: 10,
“details”: [
{
“@type”: “type.googleapis.com/ttn.lorawan.v3.ScheduleDownlinkErrorDetails”,
“path_errors”: [
{
“namespace”: “pkg/gatewayserver”,
“name”: “not_connected”,
“message_format”: “gateway {gateway_uid} not connected”,
“attributes”: {
“gateway_uid”: “blu-gtw-001@ttn”
},
“code”: 5
}
]
}
]
},
“correlation_ids”: [
“as:downlink:01EX79HVQ3M5CXQEQW0D7C65M3”,
“gs:conn:01EX79JY7G7MY03J4WN3K0BCFV”,
“gs:up:host:01EX79JY7V5FHWG8WKVJGNXYCX”,
“gs:uplink:01EX7AMV8EN02YGYTMR1NB1KSC”,
“ns:downlink:01EX7AMVNJ1JAD2YQVFGJ98FNJ”,
“ns:uplink:01EX7AMV8HJZ7D2JRWBDNEN2G9”,
“rpc:/ttn.lorawan.v3.AppAs/DownlinkQueueReplace:a8c1c3c7-349f-4d11-a97f-161faebfc197”,
“rpc:/ttn.lorawan.v3.GsNs/HandleUplink:01EX7AMV8GKVNXCVD5B99FTC5G”
],
“origin”: “ip-10-100-14-196.eu-west-1.compute.internal”,
“context”: {
“tenant-id”: “CgN0dG4=”
},
“visibility”: {
“rights”: [

But also randomly I get also “drop uplink message”

{
“name”: “gs.up.drop”,
“time”: “2021-01-29T15:06:00.088364786Z”,
“identifiers”: [
{
“gateway_ids”: {
“gateway_id”: “blu-gtw-001”,
“eui”: “C0EE40FFFF293BEE”
}
}
],
“data”: {
“@type”: “type.googleapis.com/ttn.lorawan.v3.ErrorDetails”,
“namespace”: “pkg/gatewayserver”,
“name”: “host_handle”,
“message_format”: “host {host} failed to handle message”,
“attributes”: {
“host”: “cluster”
},
“cause”: {
“namespace”: “pkg/networkserver”,
“name”: “device_not_found”,
“message_format”: “device not found”,
“correlation_id”: “dff74197a6bd4465896543457a340462”,
“code”: 5
},
“code”: 5
},
“correlation_ids”: [
“gs:conn:01EX79JY7G7MY03J4WN3K0BCFV”,
“gs:up:host:01EX79JY7V5FHWG8WKVJGNXYCX”,
“gs:uplink:01EX7AVY0MRYV0FTFQ5TBX7666”
],
“origin”: “ip-10-100-7-135.eu-west-1.compute.internal”,
“context”: {
“tenant-id”: “CgN0dG4=”
},
“visibility”: {
“rights”: [
“RIGHT_GATEWAY_TRAFFIC_READ”
]
},
“unique_id”: “01EX7AVY0R2F2HKVPZTZX2MT2F”
}

A few days have passed and I learned many things about V3 and had time to think about this problem.
I don´t think anymore that the downlinks are not sent. I thought there must be a confimation about sending them in the application, but they are generally just shown as “successfully sceduled”, which is fine if you know this.

What I am wondering now: do I have to activate confirmed Uplinks somewhere in the application to be supported? I´ll probably disable the confirmation in the node (if i figured out how to do this) but it would be useful to know anyways. Couldn´t find this in the documentation.
@htdvisser

Running a device with Confirmed Uplinks is to be avoided and not recommeded on TTN unless only transmitting as a heart beat say once per week, once per day or at most a couple of times per day - note FUP states downlink limit of 10 per day and that includes Join Accepts, ADR responses, other MAC commands, downlink messages and of course your confimed message acks!

I know!
The device has in standard configuration 1 heartbeat uplink per day, and uplinks when a water leakage occours (which is hopefully never).
So I think confirmed uplinks would be ok, but as I wrote I´m going to disable the confirmation.

But the question stays relevant for me (and probably others), does the V3 Application support confirmed uplinks and does this have to be activated somewhere?
Because this could explain the weird behaviour, shown in the first post.

V3 supports confirmed uplinks and it is initiated by the node requesting confirmation (it is a flag set in the headers vs being part of the payload), The LNS then decodes flag and responds to that - you do not need to set anything in the LNS, just configure in tne node settings/firmware…

1 Like

I tested adding a dragino door sensor to V3 which has nearly the same hardware but is sending unconfirmed uplinks.

As I expected the problem with the 7 retrys is gone, because the device doesn´t expect an Ack, so I guess thats a small win - even if it does´t solve the original problem.

It still appears that the node doesn´t get or process the downlink / MAC request, since the application scedules an device status request and ADR request - and the device keeps sending in SF12 (at least only once and only when it should).

adr request

This behaviour remids me of the “Is V3 the end for TinyLoRa” Topic. :expressionless:

I tested with both downlink settings SF9 and SF12 in the Application settings.

Is someone of Dragino in this Forum who can say something about V3 and their Sensors? Or does someone know who to ask? I guess they are already testing their products with V3.

I had similar early on in the week… It looked like a latency issue routing back to my V2 Gateway. I cut the power to the node… and I was still seeing traffic in the live data stream for the node. about 30 seconds delay.

Strangely, a few days later all okay!

There were some packet routing issues a few days back that have now been resolved.

There was an issue with delayed traffic over the packetbroker (which sits between V2 gateways and the V3 backend) earlier this week. According to Johan that has been resolved.

The Dragino stack is LoRaWAN compliant so is capable of processing downlinks just fine.

I don’t expect they are testing yet because there is no V3 in their region yet and using EU would result in large network delays. Also because the Chinese are currently celebrating new year (the 12th was the first day of the new year and festivities usually last 14 days) I do not expect any activity right now.

I tested this today, and it is the same like the day I started this topic, so I guess this is not related.

What I don´t understand: if the join process goes well (what it does), why are other downlinks not working?

Could you try with the MAC version set to 1.0.1? I know the Dragino site states 1.0.3 but a quick glance at the sources they base their firmware on makes me wonder if that is right.

Deleted the device and registered a new one with V1.0.1. - same behavior.

I’ll try to find time to run some tests with the door sensor.

1 Like

I have the same with my lora device simulator, it was working fine with V2 but it gives “Failed to schedule” when used in V3. This applies for downlinks and joins. The device and the gateway only exist in the V3 world. Also I noticed the MAC command DevStatusReq when a device joined … which can go on forever when not answered or failing to schedule after 1 or more attempts.

Screenshot 2021-02-14 at 10.54.01