After months of testing I’ve made the new multi protocol packet forwarder for MultiTech available. The new forwarder is based on poly packet forwarder but additionally supports the TTN gateway connector protocol which provides authentication of the gateway (packets from these gateways will include a ‘trusted’ flag in the metadata) and is TCP based.
This packet forwarder provides support for the new SPI based LoRaWAN mCards from MultiTech as well.
NOTE TO ALL:
During registration of a new gateway in the TTN console the gateway field is NOT set. After registering the gateway, go to the settings and make sure to set the gateway to the correct value for your region.
I have filed a ticket in the hopes this gets resolved.
edit: in the mean time I’ve added a check to the installer to alert the user (and not proceed) if the value is not set.
Well I am still having issues but not sure if its related to the new packet forwarder…
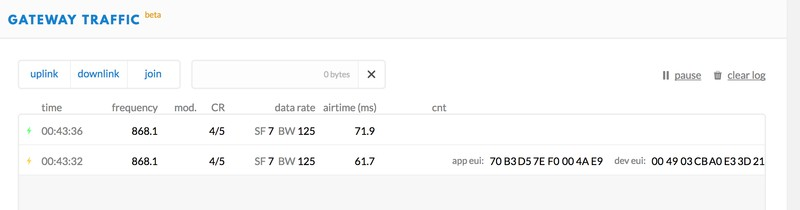
Basically the OTAA process is not completing. I see the Activation request arrive in TTN but following that nothing happens. All firewall ports are open and I see inbound and outbound traffic on port 1883 of the MultTech. However I see no traffic in any direction on port 1700.
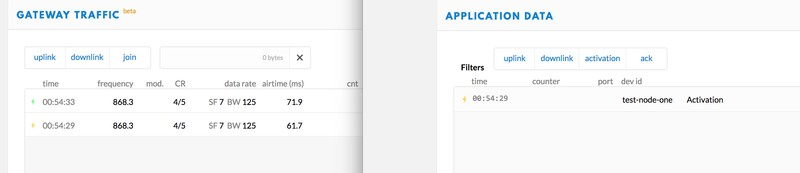
Please check the app eui and dev eui to see if they match the information registered in the console for your application. If they match you should see the the activation request in the application data as well.
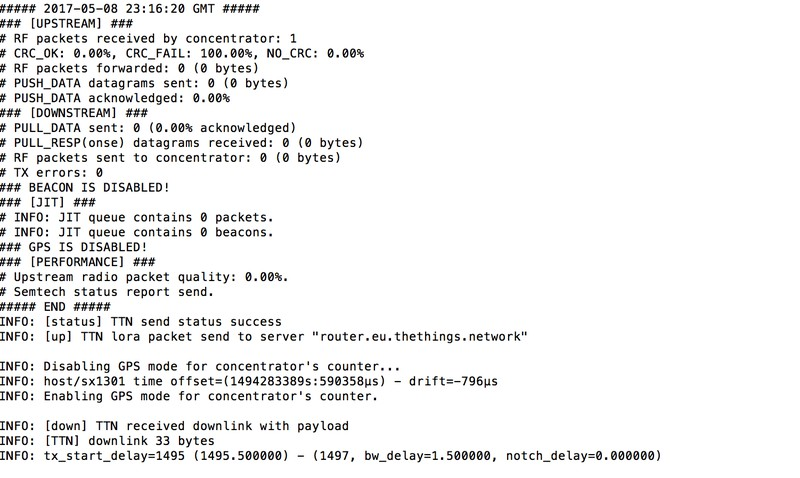
In the gateway log do you see a message ‘INFO: [down] TTN received downlink with payload’? If so the gateway is getting a response. Next step would be to look at the statistics, you should see something like:
I upgraded to this new packet forwarder yesterday. It’s all work good and I get my data on TTN and so on. But I have one “problem” if I type “tail -f /var/log/lora-pkt-fwd.log” it dose not behave that it use to. With the old packet forwarder I get “UP” and “DOWN” in real time and the status message in like 30s intervall. Now it can be quite for up to maybe 2-5min and then I get a lot of text with all my old UP/DOWN message and status message, and the text can be cut in a middle of a word. Doesn’t looks right. Any idea why ?
This is because the output is buffered. Only when a buffer of 1KB is filled that buffer is written. The buffer being full can happen anywhere in a line.
That means the packet is corrupt and will not be forwarded to TTN.[quote=“ssozonoff, post:14, topic:7117”]
Is there a way to debug whats the packet forwarder is actually doing with the packet ?
[/quote]
The counters for the JIT queue tell what happened. See my previous message with the JIT queue information. The only thing to ignore is the byte count which is not updated correctly at the moment.
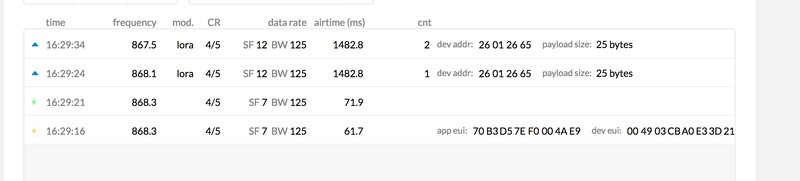
Packet to RF means it is sent by the gateway if TX error count is 0.
As you can see in your screenshot the reply is sent about 5 seconds after the packet is received. As the node listens for a reply for milliseconds at the 5 second mark the response is timing critical indeed. Any network delays or timer issues on the node can cause data to be missed.
What are the ping times from your gateway to a site like google?