I have 24 rain gauges in a forest in Mid Wales which report readings every five minutes via TTN, recently my console has stopped showing ‘live data’ for any of these devices. The data is still being received by, and forwarded by TTN. Is this a site wide issue, or just my console?
This is a regular recurring issue that is there for some time. It happens to me too with both applications as well as gateway data. There is no consistency in when it works and when not. It seems as it TTI does not bother as it is not given any attention.
Is there a Github issue with the reproduction steps?
Do you mean have I reported it on github?
If so, no, I don’t know how to do that for this issue.
Steps to ‘reproduce’ error:
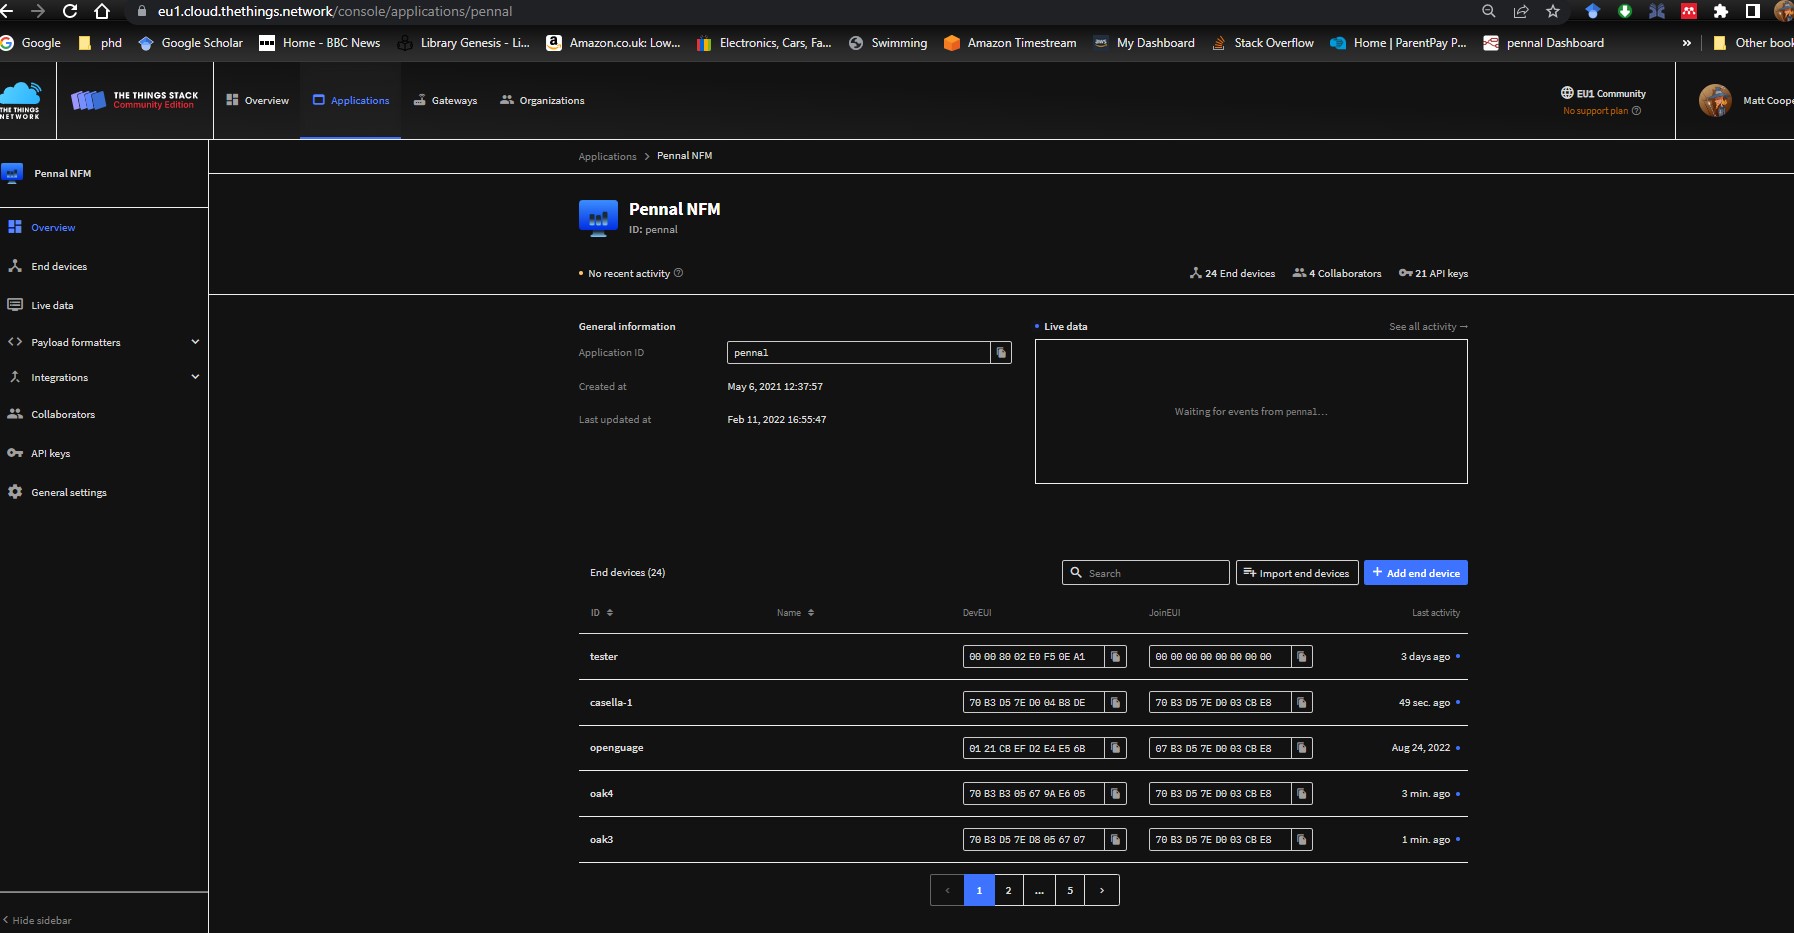
log into console
select applications
select end device
select ‘live data’
no live data
Please create a Github issue with the following
- Screenshots; Open the
Inspectoption on your browser
- A screenshot of the
Consoletab. - A Screenshot of the
Networktab.
Repeat these screenshots for the case where you have an issue and the case where you dont.
- Is this across multiple applications or on certain applications? If it’s the latter, what is the difference between those applications (in terms of device count for ex).
I suspect it may be simpler, worth trying this:
OK, that’s done, I cant comment on multiple applications, as i only have one.
I don’t think this helps, I just logged out and shut down the browser, then re-opened and re logged in. as you can see from screenshot - ‘no recent activity’, but end device ‘casella-1’ last activity was 49 seconds ago.
1 Like
I didn’t suggest a restart, please read the link with the details of the why!
ctrl + reload has no effect either, but agree that it is a browser issue, as i can see live data on chrome on my android phone
issue is apparent on chrome on windows, but not on my linux machine.
Edited to add:
trying firefox on my windows machine also has no live data
1 Like
Hmm, similar to the other issue. Further investigation required!
Although it is understandable that some administration is mandatory, it is disturbing to hide always behind a Git issue. Asking for an issue is simply saying “I do not take you serious unless you file an issue”
I can confirm that reproduction is an issue. it simply happenes. The only thing we can say is the time at which it occurs.
I will mention it when it happens again and am willing to submit a comment and contribute to an issue on Git if that helps.
I have tried before: when the issue occurs a browser change does not help.
This is the other issue with the same outcome:
@KrishnaIyerEaswaran2, you commented on this one but not the other - how do they differ?
I think it’s an os issue, as Firefox and chrome on my ubuntu and xubuntu machines, and chrome on my android devices all work fine. Interesting to know if anyone is having the same issue in Windows 11 (I’m on 10) lol I bet it works fine on XP ![]()
![]()
![]()
I haven an update to this issue. It is a problem with my antivirus software, because if I use a PC with the same software and the same config I can’t see any events but as soon as I use a different PC with a differnt antivirus I can see the whole live data.
Although it is understandable that some administration is mandatory, it is disturbing to hide always behind a Git issue. Asking for an issue is simply saying “I do not take you serious unless you file an issue”
A Github issue is not administration. It’s a necessary step to help us isolate the environment and figure out how we can reproduce it. Without reproducing an issue, we can’t solve it.
It is also necessary for us to internally allocate resources, schedule it in a milestone and track progress.
This is how most large open source projects are managed.
The Forum mods have a direct line of communication to TTI support team in case of large scale operational issues. All other errors faced go via Github.
I can confirm that reproduction is an issue. it simply happens. The only thing we can say is the time at which it occurs.
This gives us no information on what systems are affected and how to reproduce the issue. This is exactly the reason why we ask you to take the time to collect data and put it all in one place; a Github issue.
@mczakk and @gummibaerchen21: Could you please add your observations to the issue as well?
That would help us isolate items.
So @mczakk, you’ve currently isolated the issue to Chrome on Windows?
This would be useful feedback as it lets us know what triggers TTI intervention.
I’d add that I’m all macOS on my Safari / Chrome / FireFox use and as a macOS user am very superior so don’t feel the need for any antivirus software ![]()
@gummibaerchen21, you can’t imagine how useful it would be to know what the two different anti-virus packages are - it could dramatically speed up the resolution of the problem if you’ve identified the one that breaks the console. So please do tell us asap.
@mczakk, always useful to post the link of the created GitHub issue.
@KrishnaIyerEaswaran2, as the link wasn’t posted, when you put this:
it would have been useful for the link to be embedded to facilitate.
When I use the “Sophos Endpoint Agent” I can’t see any events, but ther is no informaiton about a blocked page from ttn on the log files.
On my other PC I’m using AVG Antivirus.
1 Like
@KrishnaIyerEaswaran2 no, I think I’ve isolated it to Windows, where none of Chrome, Firefox or Edge browsers will show live data, but my linux machines and android devices all show it.