I have a model of device from a particular manufacturer that work perfectly on the V2 stack (using TTN community) but when using the V3 stack (TTES - cloud hosted), I am receiving the JOIN and then one uplink, but not subsequent uplinks. I am seeing this with all devices from this manufacturer. I have tested the exact same device on both stacks and the behaviour is consistent.
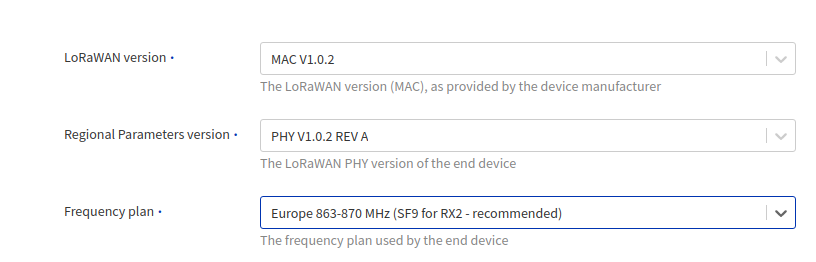
I was wondering if it’s perhaps the frequency plan, MAC version or PHY settings which are causing this? Can anyone advise what V2 uses for these settings (as you don’t get to set them) as I want to rule out this as a cause of the problem. On V3 I have tried several combinations of settings but believe it should be:
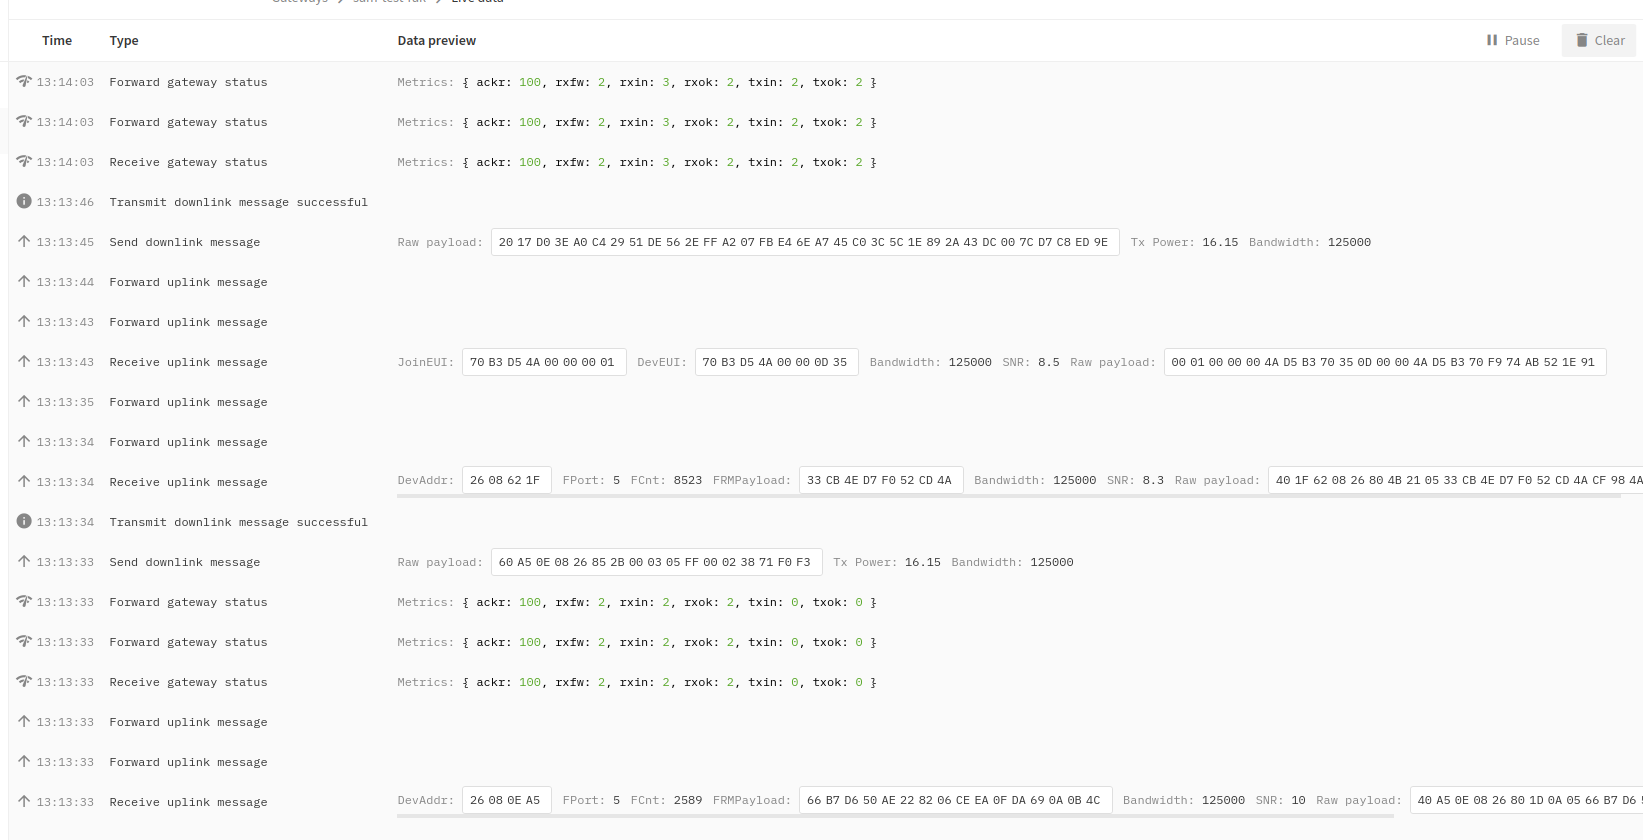
The gateway logs when joining V3 are:
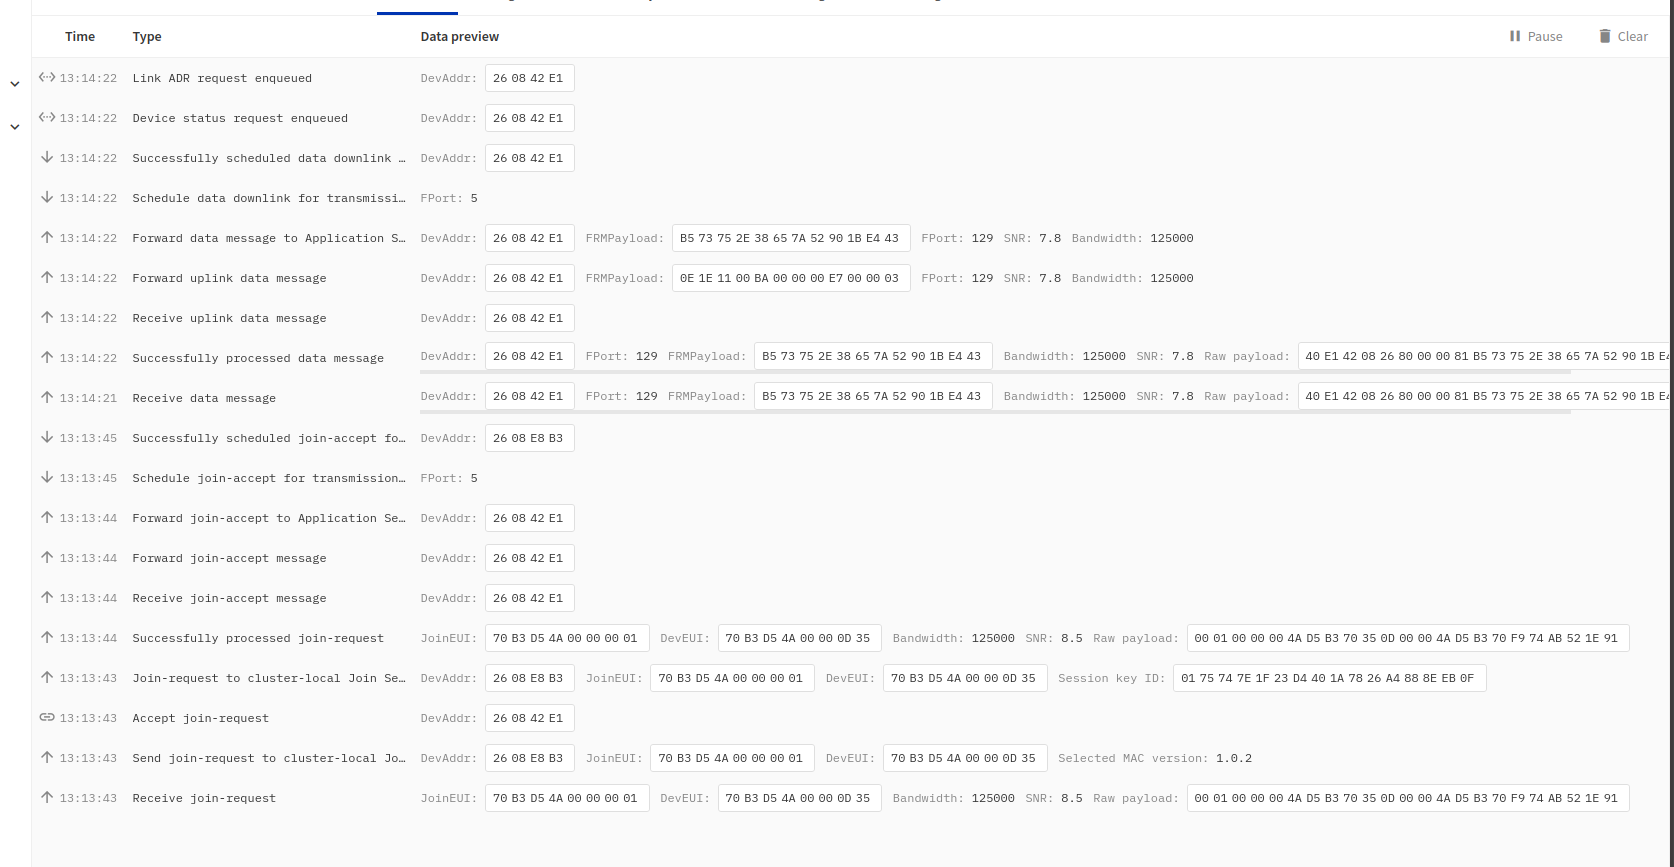
And device logs:
I have contacted the manufacturer for help but was wondering I could gain other insight from the community until I hear back.
Hi @homelync, I have seen exactly this behaviour from some Netvox sensors. After much to and fro they had to go back to the distributor for a firmware upgrade.
It was the post-join downlink sent by TTI V3 that was causing the devices to crater. I see in your device dialogue that the last device activity is a downlink.
After upgrade and return they worked fine. I was annoyed that the distributor had shipped the devices to me with out-of-date firmware. Subsequent transactions require latest firmware.
For other sensor types the purchase required that the seller state the appropriate versions of the PHY and MAC to use on TTI V3.
Thank you very much for confirming what I suspected @cultsdotelecomatgmai. Further evidence of this is supported by what I’m seeing from the gateway logs.
V2 Stack
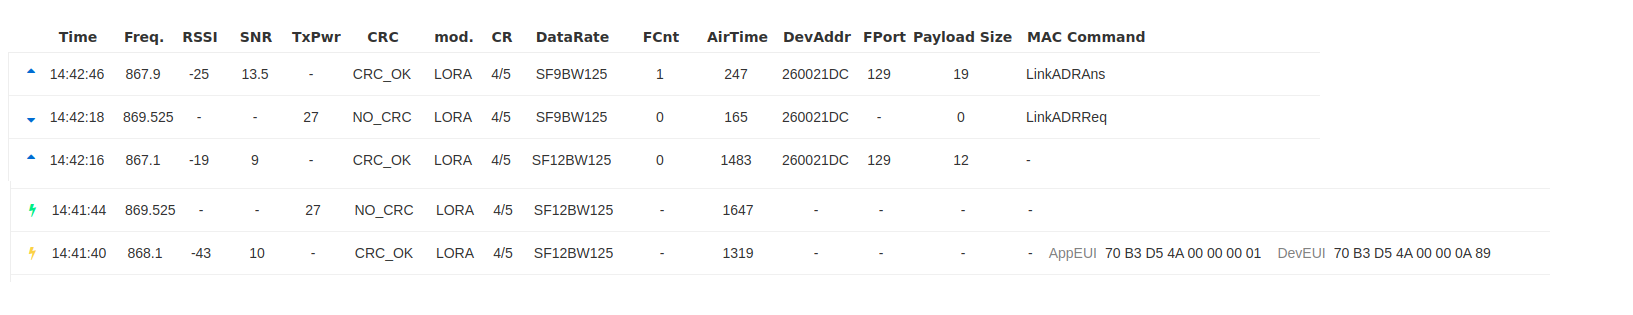
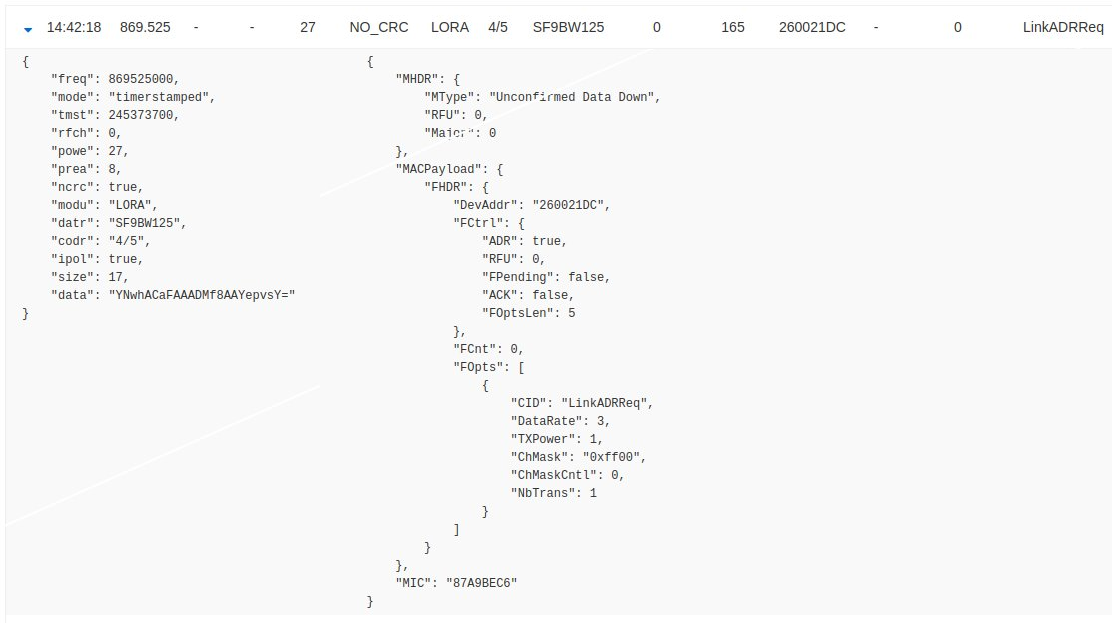
LinkADRReq Downlink
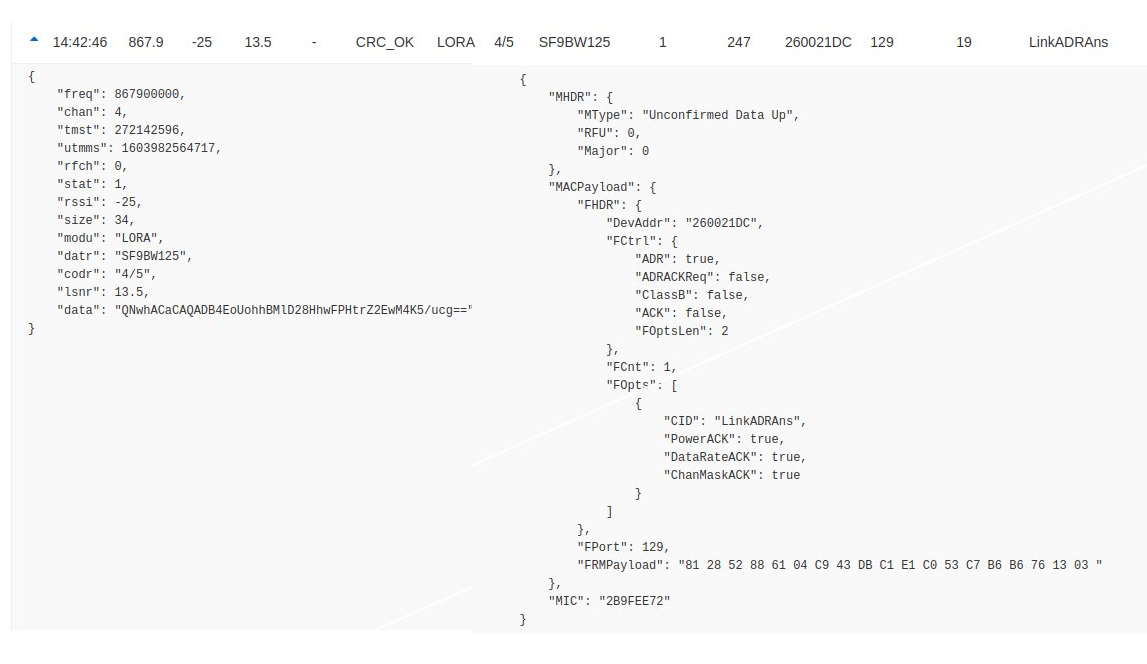
LINKADRAns Uplink
Payload of the LinkADRReq:
Payload of LinkADRAns:
V3 Stack
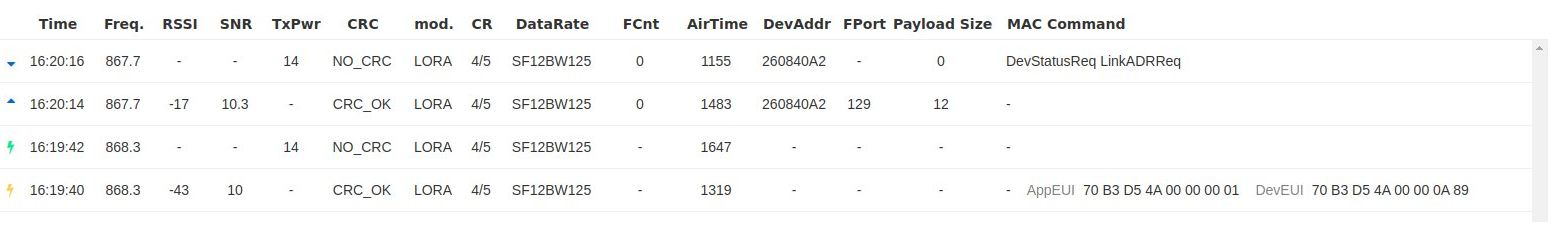
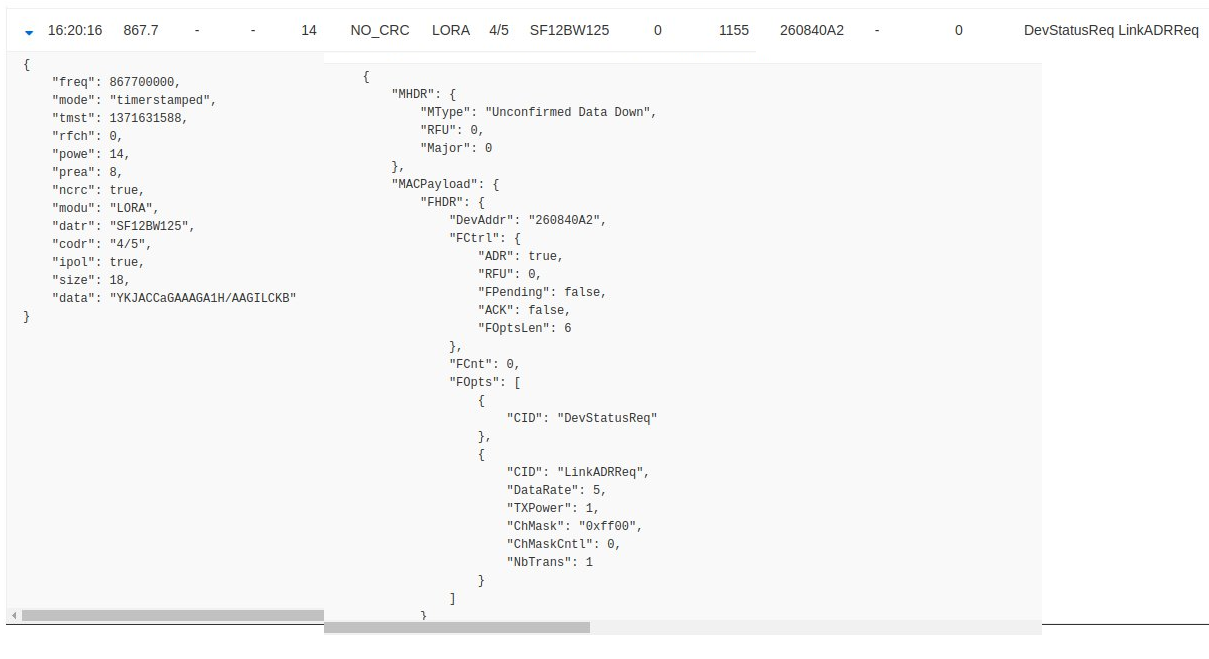
LinkADRReq Downlink
but no following LINKADRAns Uplink
Payload of the LinkADRReq:
So it looks like after the device receives the V3 LinkADRReq it doesn’t respond and it then is no longer functional, reboot results in the same sequence and the bricking of the device until another reboot.
The LinkADRReq only seems to differ in terms of data rather than shape, so this is surprising. I will of course be talking the manufacturer but could anyone shed any light on the specifics of what is causing this?
Hi @homelync, you’re welcome. Once you get this sorted please post an update to the forum.
In my opinion the planned transition of the community TTN network from V2 to V3 may be very painful for a lot of people. Hopefully there will be some sort of phased transition that allows situations like this to be identified and fixed in advance.
It would be very helpful if you could show a sequence of both the expanded uplink transmission as well as the suspect downlink. Seemingly the V2 case it is being sent in RX2, but in the V3 case it looks like RX1 settings, only the gross clock times still seem to show a 2 second delay, so it would be good to see the concentrator timestamp counters.
Also your RSSI’s are absurdly high, suggesting you have the node basically sitting on top of the gateway. This is known to cause issues; you should move the node several dozen meters away.
The advice I see being given on the forum is usually ‘at least 3m distance between node and gateway’.
“several dozen” would be some tenfold of that. Why do you suggest several dozen meters instead?
I’ve seen several 20m in free air, as well as brick wall and I say ‘computer monitor’ as that definitely does it in my office. Perhaps we need a new thread to thrash this out?
Quick update on this issue. We spoken at length with the manufacturer and they confirmed that this problem was caused by an issue with the firmware when receiving a particular type of ADR request from V3.
The problem is the downlink sent after the first message, you can confirm this if you look at your gateway log. Here is a problematic downlink :
60B0360826860100 06 0340FF0001DE960F6F
And here is a good one :
60B03608268502000331FF00018CD49A92
The difference is the 0x06 byte before the ADR request.
We have now updated the devices with patched firmware and the problem has been resolved!
Is the downlink problematic from device point of view or from standards point of view? (You probably know the answer and we would all have to get the standard and decode the packet by hand to know the answer)
@kersing I’m afraid I don’t have the answer to your question, I know for a fact it is problematic for the device but not whether this is due to a firmware specific issue or a standards issue. I will try to find this out.
The additional 06 is in the in the Fopts field of the header and is a DevStatusReq, the reply would provide battery and margin information to the backend. So the packet is valid it is just the device firmware that doesn’t handle it correctly.
The definition of margin is:
The margin (Margin) is the demodulation signal-to-noise ratio in dB rounded to the nearest integer value for the last successfully received DevStatusReq command. It is a signed integer of 6 bits with a minimum value of -32 and a maximum value of 31.
With different devices, Dragino LHT65, I see the same sort of behaviour. They work fine on TTN v2.
However ,in TTN v3 the LHT65 end devices seem to work, I see “join_accept” messages received on my web server and in the TTN v3 console Application->LiveData view after ‘restarting’ the LHT65s (sleeping them and waking them again). However, I get no indication that the LHT65 are sending their data packets (uplinks) through the TTN v3 system. I can trigger the LHT65s and see the lovely blue flash of the LED but I can find no evidence that they are connecting to the TTN system and the v3 webhook isn’t triggered (it was for the join messages).
Based on the above I will reach out to Dragino to see if this is a known problem and if there’s a solution.
I just unboxed a new Dragino device, added it to V3 and everything works as expected. Are you sure your node is not registered in V2 as well? (In which case it might accept the V2 join information and transmissions can’t be matched to the V3 assigned DevAddr and keys)
I couldn’t figure out migration so I just deleted them from v2 (I was just testing and learning) and then added them to the v3 system. I have a Dragino DLOS8 gateway. That seems to be working fine on v3 (as it was on v2) once I realised that the Dragino LoRaWAN settings widget needs to be set to use a “Custom/Private LoRaWAN” Service Provider with the “Gateway Server address” given in the TTNv3 gateway’s page.
I deleted the devices from the TTN v2 network before adding them to the v3. If I sleep the LHT65 and then wake it up again I see a “join_accept” pass through to my TTNv3 web hook (to my own web server) but never see any sensor data get sent. It worked fine in TTN v2.
Do you have a gateway? It would be interesting to see if there is any traffic from the node after the join accept, but you need to be able to look at gateway traffic to be able to see that.
Yes, I have a Dragino DLOS8 but its display traffic widget doesn’t (never did) show anything. The gateway’s Live Data widget on TTNv3 shows the accept messages passing but nothing else, even when I trigger the end node devices manually (there’s a button on them). The gateway is letting TTNv3 know (or vice-versa) that it’s alive every 30 seconds or so that part is working fine.
I’m assuming at this point that the end-devices don’t work properly on TTNv3 (that’s refuted in a comment above) or that their traffic is still getting routed to TTNv2 somehow though they have been deleted there (I’ve got no devices or applications of any kind available any longer in my TTNv2 console). I suppose I could try removing them from TTNv3 and putting them back on TTNv2 to see if they (still) work there.
In the gateway view of TTN you should see both the request and the scheduled answer. If you just see the request the application doesn’t match the EUIs and AppKey.
Can you grab the join sequence you see at gateway level and post it? (All traffic for about 2 seconds before and 7 seconds after the join would be great)
How does one “grab the join sequence”? There doesn’t seem to be a way to export or even select the text that shows up in the “Live Data” widget. Aside, that is, from clicking on each event and copying the text out of the popup panel.