The additional 06 is in the in the Fopts field of the header and is a DevStatusReq, the reply would provide battery and margin information to the backend. So the packet is valid it is just the device firmware that doesn’t handle it correctly.
The definition of margin is:
The margin (Margin) is the demodulation signal-to-noise ratio in dB rounded to the nearest integer value for the last successfully received DevStatusReq command. It is a signed integer of 6 bits with a minimum value of -32 and a maximum value of 31.
With different devices, Dragino LHT65, I see the same sort of behaviour. They work fine on TTN v2.
However ,in TTN v3 the LHT65 end devices seem to work, I see “join_accept” messages received on my web server and in the TTN v3 console Application->LiveData view after ‘restarting’ the LHT65s (sleeping them and waking them again). However, I get no indication that the LHT65 are sending their data packets (uplinks) through the TTN v3 system. I can trigger the LHT65s and see the lovely blue flash of the LED but I can find no evidence that they are connecting to the TTN system and the v3 webhook isn’t triggered (it was for the join messages).
Based on the above I will reach out to Dragino to see if this is a known problem and if there’s a solution.
I just unboxed a new Dragino device, added it to V3 and everything works as expected. Are you sure your node is not registered in V2 as well? (In which case it might accept the V2 join information and transmissions can’t be matched to the V3 assigned DevAddr and keys)
I couldn’t figure out migration so I just deleted them from v2 (I was just testing and learning) and then added them to the v3 system. I have a Dragino DLOS8 gateway. That seems to be working fine on v3 (as it was on v2) once I realised that the Dragino LoRaWAN settings widget needs to be set to use a “Custom/Private LoRaWAN” Service Provider with the “Gateway Server address” given in the TTNv3 gateway’s page.
I deleted the devices from the TTN v2 network before adding them to the v3. If I sleep the LHT65 and then wake it up again I see a “join_accept” pass through to my TTNv3 web hook (to my own web server) but never see any sensor data get sent. It worked fine in TTN v2.
Do you have a gateway? It would be interesting to see if there is any traffic from the node after the join accept, but you need to be able to look at gateway traffic to be able to see that.
Yes, I have a Dragino DLOS8 but its display traffic widget doesn’t (never did) show anything. The gateway’s Live Data widget on TTNv3 shows the accept messages passing but nothing else, even when I trigger the end node devices manually (there’s a button on them). The gateway is letting TTNv3 know (or vice-versa) that it’s alive every 30 seconds or so that part is working fine.
I’m assuming at this point that the end-devices don’t work properly on TTNv3 (that’s refuted in a comment above) or that their traffic is still getting routed to TTNv2 somehow though they have been deleted there (I’ve got no devices or applications of any kind available any longer in my TTNv2 console). I suppose I could try removing them from TTNv3 and putting them back on TTNv2 to see if they (still) work there.
In the gateway view of TTN you should see both the request and the scheduled answer. If you just see the request the application doesn’t match the EUIs and AppKey.
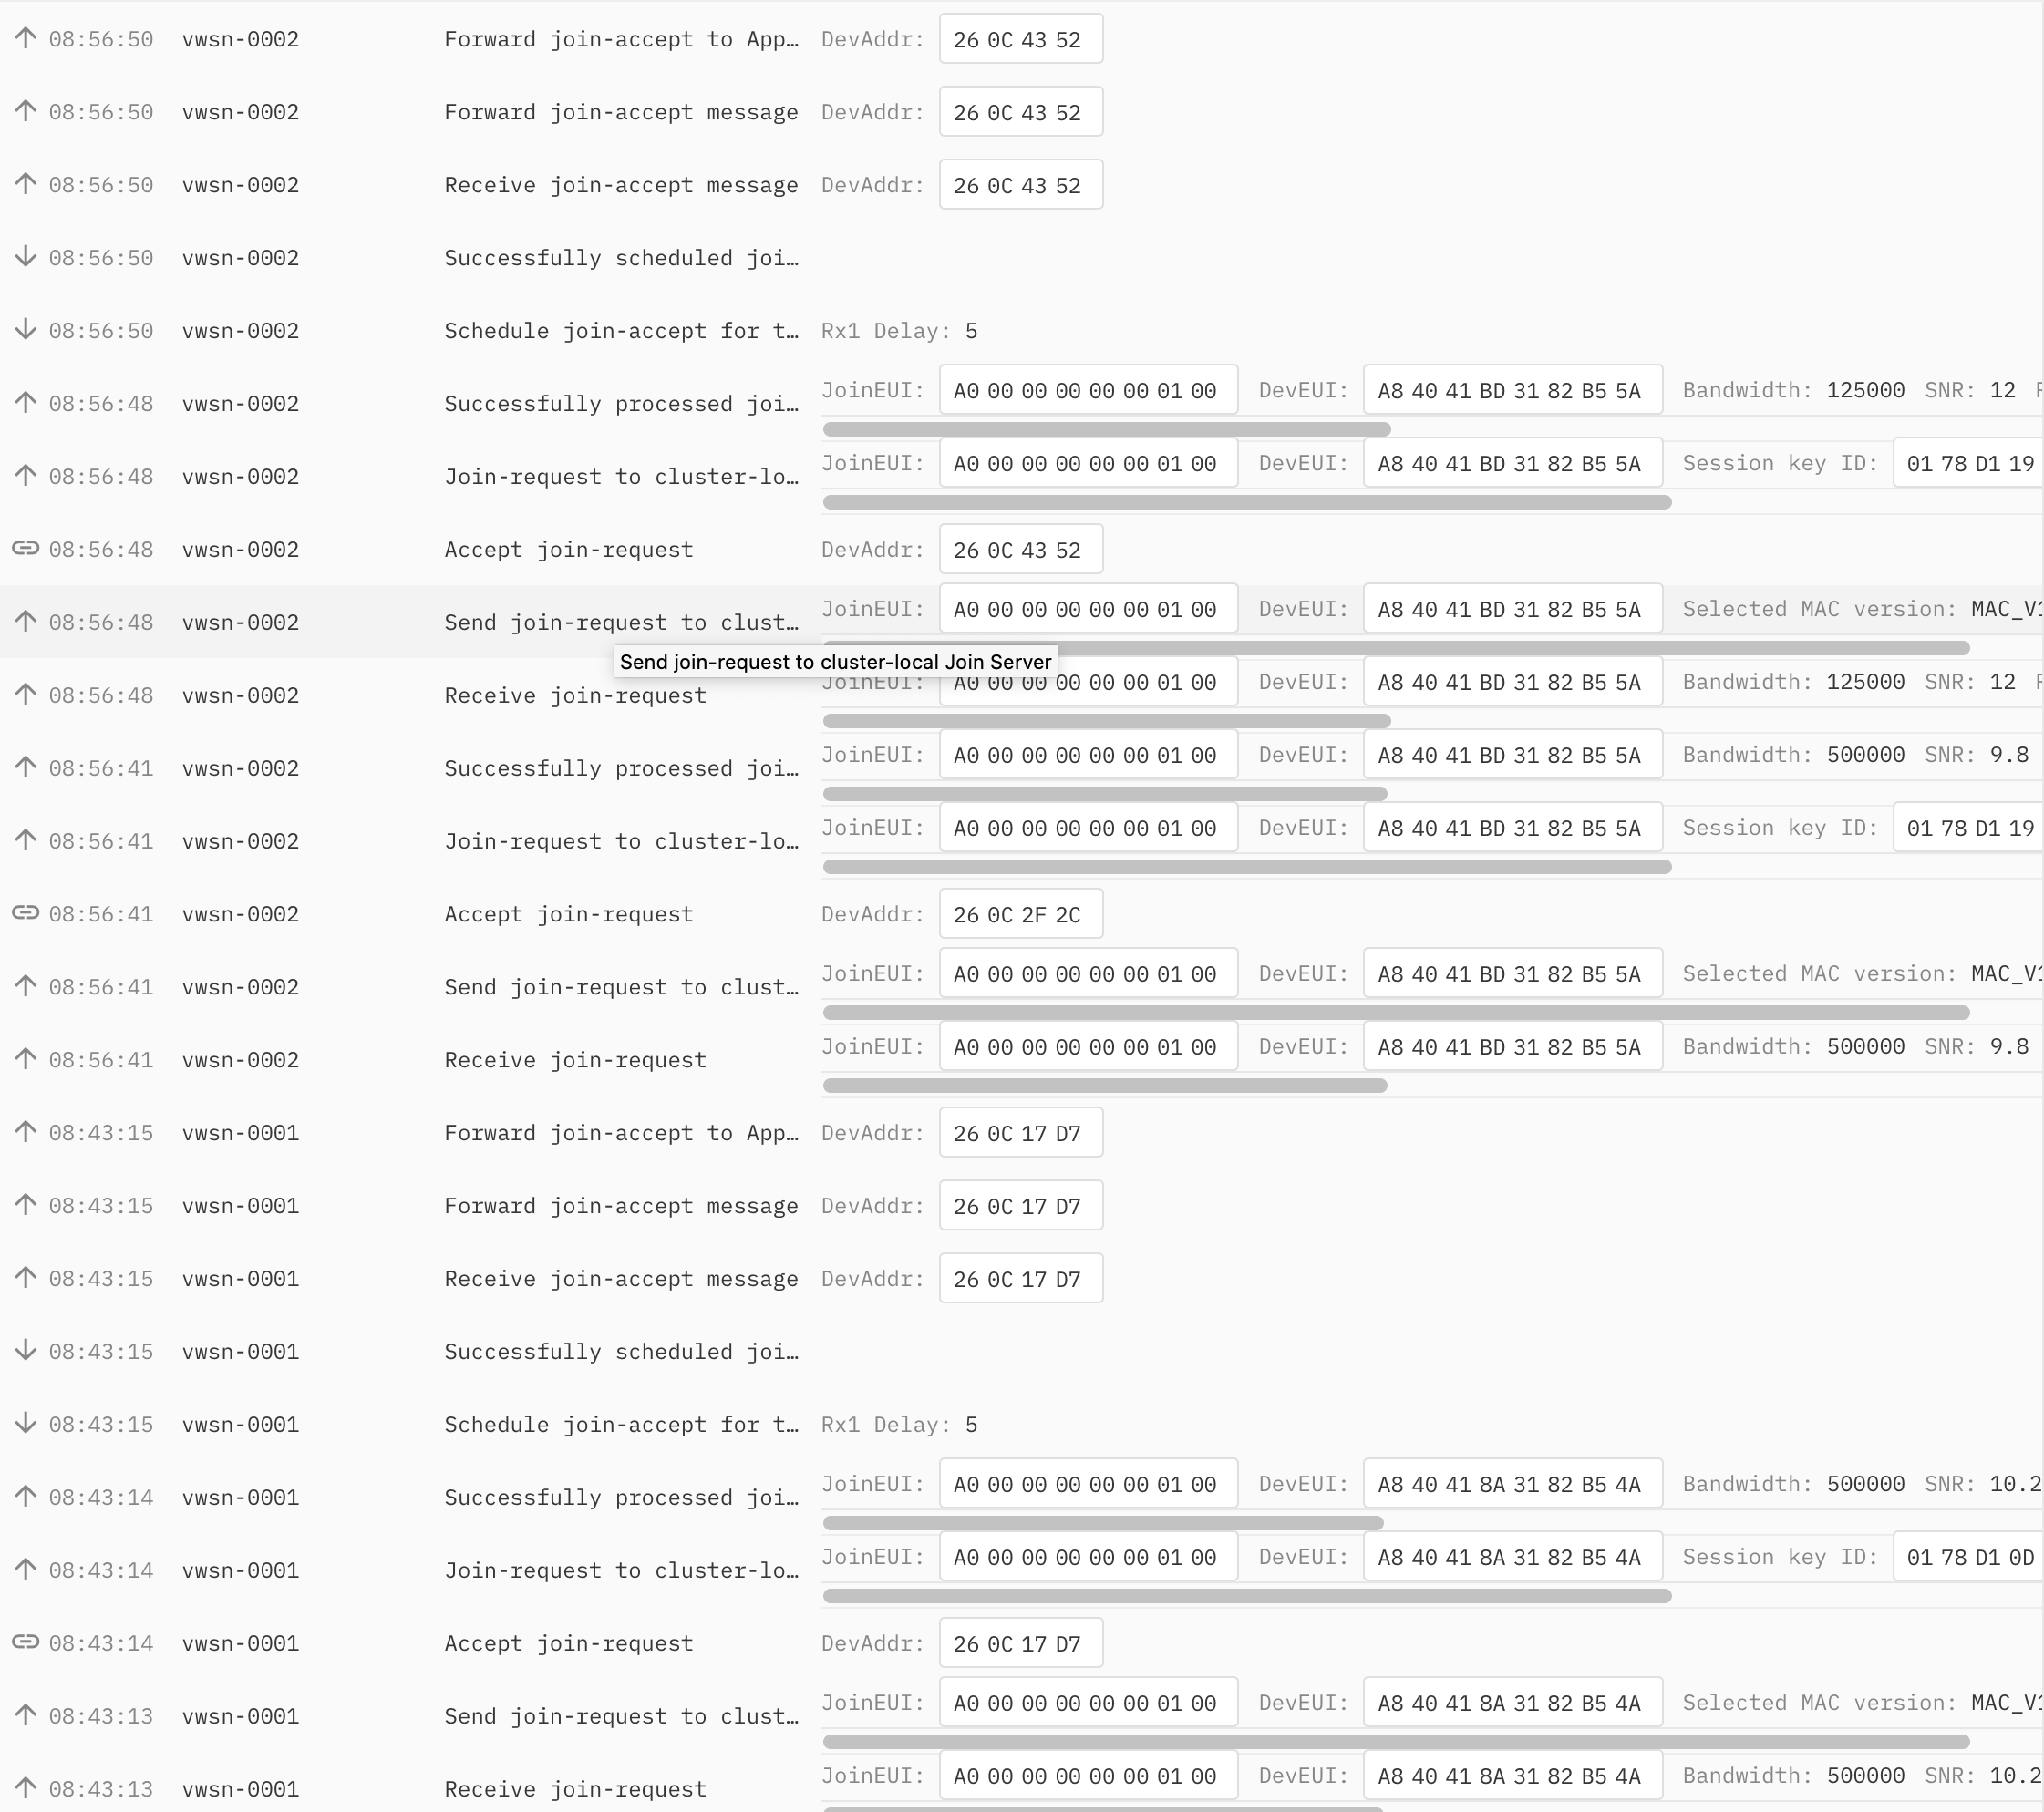
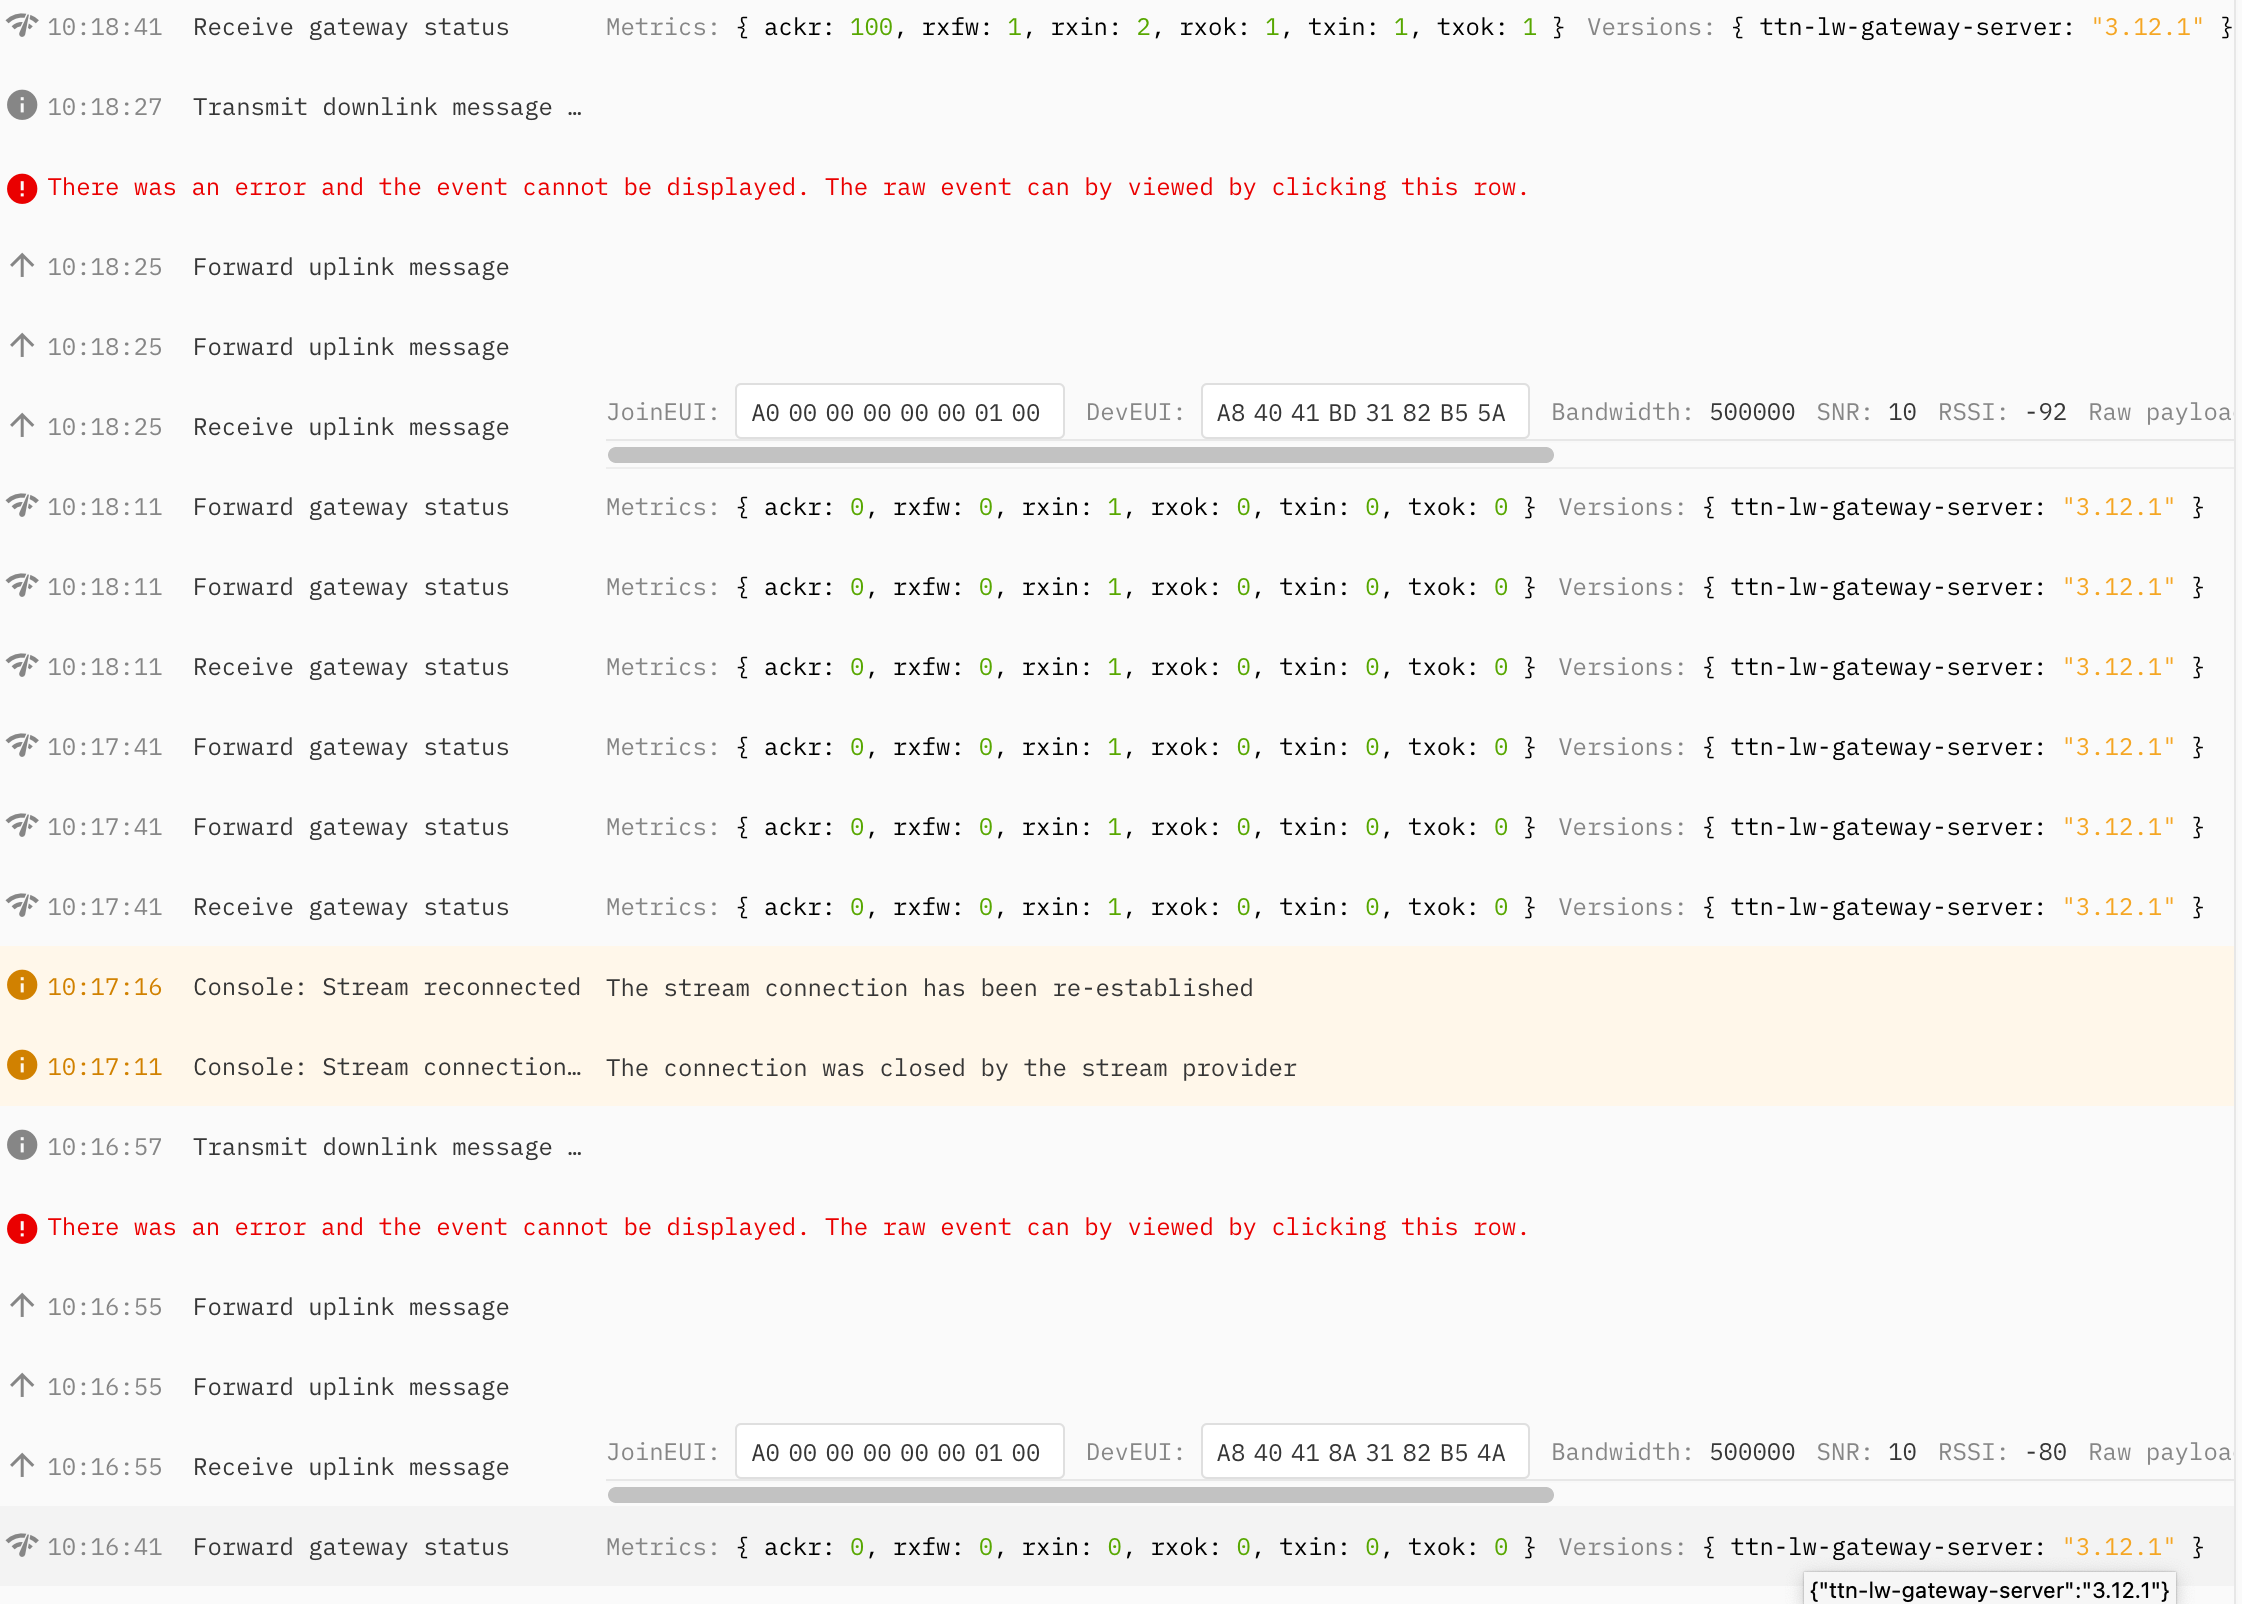
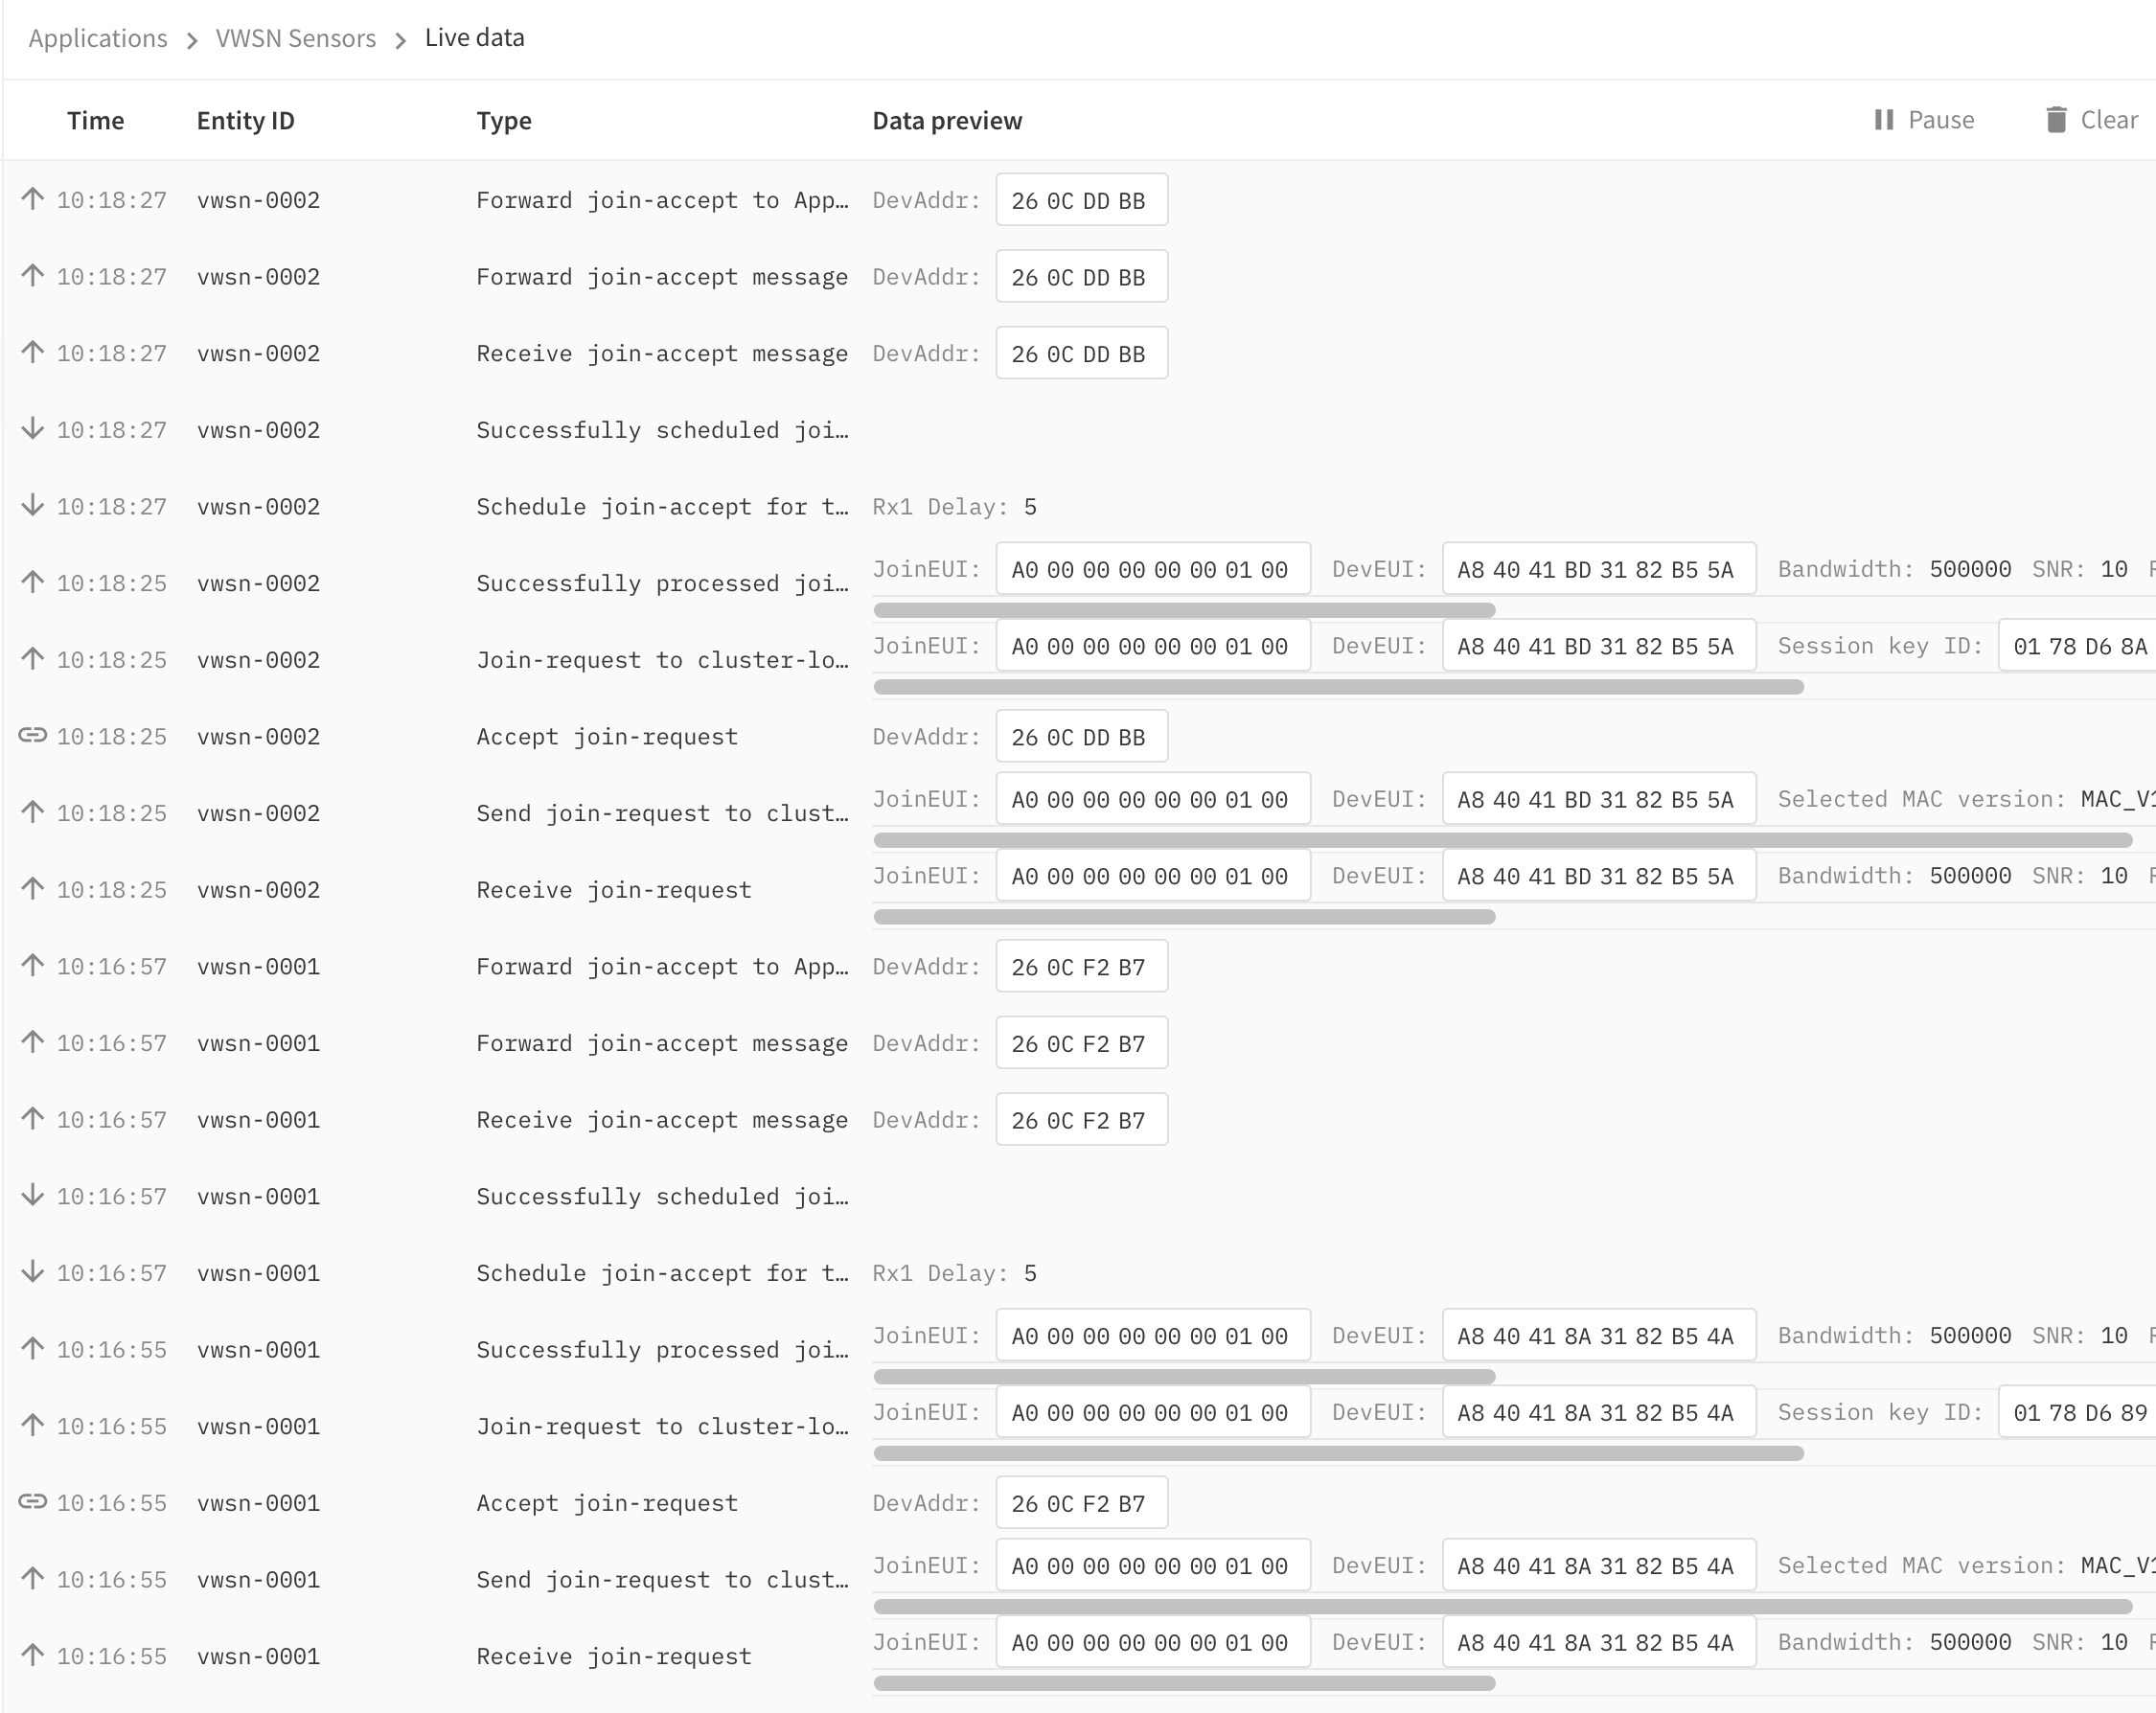
Can you grab the join sequence you see at gateway level and post it? (All traffic for about 2 seconds before and 7 seconds after the join would be great)
How does one “grab the join sequence”? There doesn’t seem to be a way to export or even select the text that shows up in the “Live Data” widget. Aside, that is, from clicking on each event and copying the text out of the popup panel.
If there is no option to cut-and-paste the text most forum users use a (or more) screen shot of the relevant information. Would that be possible for you? (I don’t know which OS you use so I won’t assume you have the option.)
Two different but alike end devices. It all looks good to me. Maybe I just need to be patient. I am learning that about this stuff. Instant isn’t the way it works.
The DLOS8 is outside. The LHT65s are about 4 m and 10 m away from the physical gateway device. I just triggered the LHT65 to try to join and I see the traffic in the TTN v3 gateway console and in the application console. I also see the “join_accept” JSON blobs pass through the TTNc3 webhook to my server. I’ll try moving the end-devices farther away from the LSO8.
No, this is not resolved yet. I am going through some support steps with someone from Dragino but I have to wait for an adapter (ordered yesterday) for the serial cabling. At this point they’ve asked me to dump the config from the LHT65 and send it to them. It all worked well on TTNv2. :^(
Thanks, I had 1 working on TTN V2 but it stopped on 04/13 (after the TTN V2 upgrade??) but I thought it maybe bricked so I bought another and installed on V3 with the results that are the same as yours. I ordered a programmer because I’m pretty sure my LHT65’s will need firmware upgrades but lots unknown at this point.
I will post here if and when I find a solution for TTNv3. I am assuming at this point that there is some detail in the internal config of the LHT65 that isn’t meshing well with the new system.
Updating to Firmware 1.8 (Dragino Download Server ./downloads/LHT65/Firmware/v1.8/) mine joins the v3 Network and reports again.
Before it sent traffic to my Gateway, that could be seen on the GW but never made it to the v3 Network. A manual rejoin (holding the button for a long time) caused a join-loop. What a luck that I got my programmer working so that I could update the FW. My smt v2 has a Problem with the reset Pin so I needed to connect it to ground and remove it after the light on the programmer blinks, see Dragino’s FAQ.
One of the advantages of having problems is that I’ve learned a lot. I updated the LHT65 firmware to v1.8. I was checking settings using the LHT65 serial console when I noticed that it was set to sub-band 1 so I changed that to sub-band 2 for uplink which to my understanding is what the TTIG uses. Unfortunately, I still get the same result as the one you posted on 5/15. My test LHT65 is on TTN v3 and my TTIG is on v2. I rarely see traffic on my v2 TTIG but I do get Application live data on v3 but never a data packet. The last message I ever see in the Application live data is “Forward join-accept to Application Server”.

 I’ll try moving the end-devices farther away from the LSO8.