Since 2 p.m. CET, data has only been partially transported via TTN V3. Is it just me who have the problem or does it occur elsewhere?
Thanks
Paul.
3 Likes
Which bit of data - gateway uplinks, integrations, console - I’m using various bits of all of that but something to focus on would be better.
I see also long delays and cannot join.
My gateway logs:
Type Rx
Time Feb/28/2021 16:20:58
Gateway ID 343632383B007600
Message Type Join-request
Major Version LoRaWAN R1
Join EUI XXX
Dev EUI XXX
Dev Nonce 561
Meta
Freq (MHz) 868.300
Modulation LoRa
Bandwidth 125 kHz
Datarate SF 7
Coderate 4/5
IF Chain 1
CRC Status Ok
Counter (us) 1589396713
RF Chain 1
RSSI (dB) -59.00
SNR (dB) 9.50
SNR Min (dB) 6.25
SNR Max (dB) 13.75
CRC 51002
Size 23
Payload ALdQA9B+1bNwUd0s6KTGugAxAs7nZ0w=
The received message in V3 console is:
{
“name”: “ns.up.join.receive”,
“time”: “2021-02-28T15:39:26.766991388Z”,
“identifiers”: [
{
“device_ids”: {
“device_id”: “bk1”,
“application_ids”: {
“application_id”: “test-pinky”
},
“dev_eui”: “XXX”,
“join_eui”: “XXX”,
“dev_addr”: “XXX”
}
}
],
“data”: {
“@type”: “type.googleapis.com/ttn.lorawan.v3.UplinkMessage”,
“raw_payload”: “ALdQA9B+1bNwUd0s6KTGugAxAs7nZ0w=”,
“payload”: {
“m_hdr”: {},
“mic”: “zudnTA==”,
“join_request_payload”: {
“join_eui”: “XXX”,
“dev_eui”: “XXX”,
“dev_nonce”: “0231”
}
},
“settings”: {
“data_rate”: {
“lora”: {
“bandwidth”: 125000,
“spreading_factor”: 7
}
},
“data_rate_index”: 5,
“coding_rate”: “4/5”,
“frequency”: “868300000”
},
“rx_metadata”: [
{
“gateway_ids”: {
“gateway_id”: “packetbroker”
},
“packet_broker”: {
“message_id”: “01EZMKMX7DJN93JBX4HMVX3RHT”,
“forwarder_net_id”: “000013”,
“forwarder_tenant_id”: “ttn”,
“forwarder_cluster_id”: “ttn-v2-eu-4”,
“home_network_net_id”: “000013”,
“home_network_tenant_id”: “ttn”,
“home_network_cluster_id”: “ttn-eu1”,
“hops”: [
{
“received_at”: “2021-02-28T15:20:58.349194654Z”,
“sender_address”: “52.169.150.138”,
“receiver_name”: “router-dataplane-7b8dc4849b-jtd55”,
“receiver_agent”: “pbdataplane/1.4.1 go/1.15.8 linux/amd64”
},
{
“received_at”: “2021-02-28T15:35:26.408165562Z”,
“sender_name”: “router-dataplane-7b8dc4849b-jtd55”,
“sender_address”: “forwarder_uplink”,
“receiver_name”: “router-7fd4d77db-rmtg7”,
“receiver_agent”: “pbrouter/1.4.1 go/1.15.8 linux/amd64”
},
{
“received_at”: “2021-02-28T15:39:26.751063916Z”,
“sender_name”: “router-7fd4d77db-rmtg7”,
“sender_address”: “deliver.000013_ttn_ttn-eu1.uplink”,
“receiver_name”: “router-dataplane-7b8dc4849b-sg5zt”,
“receiver_agent”: “pbdataplane/1.4.1 go/1.15.8 linux/amd64”
}
]
},
“time”: “2021-02-28T15:20:58.306055Z”,
“rssi”: -59,
“channel_rssi”: -59,
“snr”: 9.5,
“uplink_token”: “eyJnIjoiWlhsS2FHSkhZMmxQYVVwQ1RWUkpORkl3VGs1VE1XTnBURU5LYkdKdFRXbFBhVXBDVFZSSk5GSXdUazVKYVhkcFlWaFphVTlwU214TmFtczFVbXRhVkZNd09WcGFiVFV3VGxkd2VVbHBkMmxrUjBadVNXcHZhV0pxV2sxU1JGcEVWVVZ3TTFOVmJFVmpSelZ6WWpKYWVGRXlVazVSVTBvNUxuVmZTVlJDTmtsUlJEZFRjWFk0YWxSTlMyNW5UMUV1UTJSVWFWZE9WRFV6ZFZkSFJFMXlRUzV3VkY4d1gyOVBlWFJPUjBORllqbHFhelZwVFhRdFUyVTNZalpOTUZWb1RtSllabkJTUlRSc2NuRk1OMko0YkhodVVXazVObU4yUWxadVpsWkRhVUZEUm5CUVZrZEVVSEJGWDNkelVUbEViR2RMTjNRME5WUXhhWFJmUTFwQ1VVbFNibTVmTkdjeFZqQTNWbHA2WlVaRk5FdDJhbWRYUjFablQzSnJNazVtU25CSlYwaHhiMVZvVVZkRGVFc3hPRXB2VlZoeFgyTm1iMkpIU1RWS2VYWlhibFV6VUVKMlQyVkhjRloyTG5GcloxSk9OMWR3V1U0d1kwMVBPVlJyVVVoNU5YYz0iLCJhIjp7ImZuaWQiOiIwMDAwMTMiLCJmdGlkIjoidHRuIiwiZmNpZCI6InR0bi12Mi1ldS00In19”
}
],
“received_at”: “2021-02-28T15:39:26.754627933Z”,
“correlation_ids”: [
“ns:uplink:01EZMMPQN29HJPQ6TW82JF9GDE”,
“pba:conn:up:01EZMJYP8BR75RK2SY84MFMKNR”,
“pba:uplink:01EZMKMX7DJN93JBX4HMVX3RHT”,
“rpc:/ttn.lorawan.v3.GsNs/HandleUplink:01EZMMPQN2Q718327MMVB34YEC”
],
“device_channel_index”: 1,
“consumed_airtime”: “0.061696s”
},
“correlation_ids”: [
“ns:uplink:01EZMMPQN29HJPQ6TW82JF9GDE”,
“pba:conn:up:01EZMJYP8BR75RK2SY84MFMKNR”,
“pba:uplink:01EZMKMX7DJN93JBX4HMVX3RHT”,
“rpc:/ttn.lorawan.v3.GsNs/HandleUplink:01EZMMPQN2Q718327MMVB34YEC”
],
“origin”: “ip-10-100-6-221.eu-west-1.compute.internal”,
“context”: {
“tenant-id”: “CgN0dG4=”
},
“visibility”: {
“rights”: [
“RIGHT_APPLICATION_TRAFFIC_READ”
]
},
“unique_id”: “01EZMMPQNERV2G0N4ZMQCDSN06”
}
Note the timestamps!
The problem seems to exist intermittently. I am currently receiving all the data again.
Any chance you can edit this so it’s just got the relevant lines in it with any supporting material please.
It seems there a big delays of many minutes(!) inside the TTN network.
Sorry, can’t see the timestamps due to the blizzard of log in the message above 
Same problem here, no data transfer for about 4 hours.
No join possible, in V2 everything was ok.
1 Like
What bothers me is the fact that TTN’s internal monitoring didn’t seem to notice these errors.
The status page https://status.thethings.industries/ did not show any issue.
1 Like
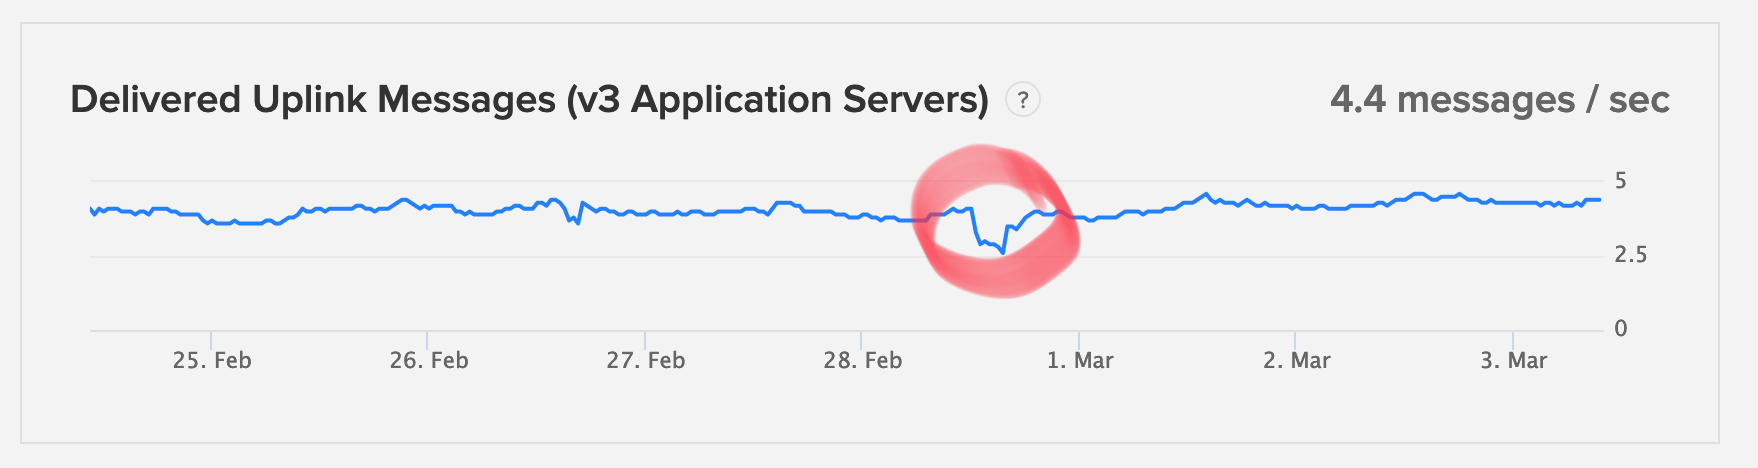
There were indeed routing issues in Packet Broker on 2021-02-28 that caused delivery delays to The Things Network V3 clusters.
The status page of The Things Network is https://status.thethings.network/, and there you do see a bit of a drop in delivered uplink messages around the time of the Packet Broker issues:
1 Like
Thanks for this pointer!
To explain, why I assumed it is the other page: The new console The Things Network Console links to the documentation on Home | The Things Stack for LoRaWAN. There is under https://www.thethingsindustries.com/docs/the-things-stack/troubleshooting/ the reference to a status page. I propose, that the different status pages are mentioned there.
For the insider’s expert eye this partial decrease in delivered uplink messages may be interpreted as issues with packet broker and routing. For the average user even when technical savvy this only shows some decrease but it does not indicate that there is a problem that may affect them. The decrease could have different causes.
It would be useful if information will also be shown in text messages (e.g. ‘there currently are some routing issues in packet broker that affect delivery of V2 gateway traffic to V3’) that are easy to understand by everyone and can prevent unnecessary questions on the forum.
With preferably a follow up message when the issue has been fixed.
1 Like
A power outage at my home office & Lab knocking out my test GW’s & Nodes would likely show a dip of that magnitude! ![]()
![]()
…but @Bluejedi is correct that something explicit required as such a graph is not very enlightening to us mortals ![]()
Or a solar radiation storm hitting your gateways.
Or tripping over the pile of boxes on the door to his office, taking out the router.
My wife been snitching again has she?! Ok Ok will tidy up…one day
This topic was automatically closed 30 days after the last reply. New replies are no longer allowed.