ProMini/RFM95 node downlink error on V3

I have a ProMini/RFM95 node that worked fine for years on TTNV2 with OTAA
I manually defined an end device in TTNV3 and recompiled the sketch with MCCI_LMIC 4.1.0

OTAA Join works OK and messages arrive in the TTN Console.

Always after exactly Fcnt 19 the transmission stops with:

Schedule data downlink for transmission on Gateway Server

My TTIG gateway also stops receiving messages while the node is still sending messages

It looks my node is not receiving messages.

Could there be something wrong with my end device definition in the TTN console?

arrow_downward
15:50:32
eui-70b3d57ed004a696
Schedule data downlink for transmission on Gateway Server

Rx1 Delay
    5

arrow_upward
15:50:31
eui-70b3d57ed004a696
Forward uplink data message

MAC payload
    010099
FPort
    1
Data rate
    SF7BW125
SNR
    -7.5
RSSI
    -123

arrow_upward
15:50:31
eui-70b3d57ed004a696
Successfully processed data message

DevAddr
    260BEE92
FCnt
    19
FPort
    1
Data rate
    SF7BW125
SNR
    -7.5
RSSI
    -123

arrow_upward
15:49:22
eui-70b3d57ed004a696
Forward uplink data message

MAC payload
    010098
FPort
    1
Data rate
    SF7BW125
SNR
    8
RSSI
    -71

arrow_upward
15:49:22
eui-70b3d57ed004a696
Successfully processed data message

DevAddr
    260BEE92
FCnt
    18
FPort
    1
Data rate
    SF7BW125
SNR
    8
RSSI
    -71

arrow_upward
15:48:14
eui-70b3d57ed004a696
Forward uplink data message

MAC payload
    010098
FPort
    1
Data rate
    SF7BW125
SNR
    9.25
RSSI
    -71

How many downlinks are you trying to send, in what amount of time?

LoRaWAN is an “uplink mostly” network - downlinks are supposed to be extremely rare.

I don’t send downlinks at all.
It is just a sensor sketch sending measurements uplink.

I have no idea what is trying to start a downlink.
Is it part of the protocol because of settings in the TTN end device definition?

In the end device General settings/Network layer/Advanced MAC settings
I already did set the “Status count periodicity” and the “Status time periodicity” to zero in the idea to prevent downlink messages.
However the “Status count periodicity” gets automaticly set back to 200 ??!!

This is the first time the node is connected to the V3 stack.
The node has the mcci-lmic library 4.1 so should be fully compliant.

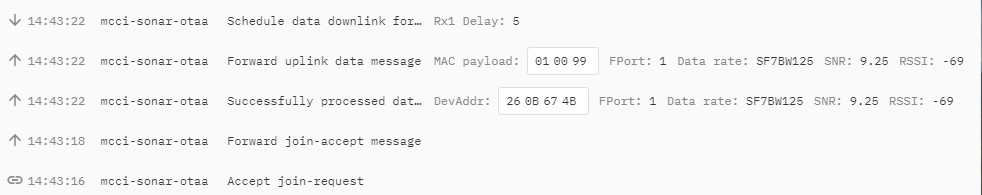
Join is ok! See the app console screenshot below

After one or more uplink messages TTS sends a downlink message (The application does not send downlinks)
From that moment on the GW and the App console don’t show uplink messages anymore. (The node keeps on sending!)

I am including the GW and App Event details for the downlink.

Sorry, I don’t have the skill to interpret the event details.
Searching the forum also was without result.

Anybody having a clou what is happening here?

Console log
GWConsole 2021-12-30 144625

Application log
AppConsole 2021-12-30 144455

Gateway Console Event detail for the downlink

  "name": "gs.down.send",
  "time": "2021-12-30T13:43:18.735781335Z",
  "identifiers": [
    {
      "gateway_ids": {
        "gateway_id": "eui-58a0cbfffe800f41"
      }
    },
    {
      "gateway_ids": {
        "gateway_id": "eui-58a0cbfffe800f41",
        "eui": "58A0CBFFFE800F41"
      }
    }
  ],
  "data": {
    "@type": "type.googleapis.com/ttn.lorawan.v3.DownlinkMessage",
    "raw_payload": "IHbT5nHODERCYOpXJ9eYEoI8o2yzn5K+BVu5e4x3FJ8i",
    "request": {
      "downlink_paths": [
        {
          "uplink_token": "CiIKIAoUZXVpLTU4YTBjYmZmZmU4MDBmNDESCFigy//+gA9BEMPnrqoJGgwI9O62jgYQmrfuuQMguOPY/fKqCioMCPTuto4GEPSot4gD"
        }
      ],
      "rx1_delay": 5,
      "rx1_data_rate": {
        "lora": {
          "bandwidth": 125000,
          "spreading_factor": 7
        }
      },
      "rx1_frequency": "868300000",
      "rx2_data_rate": {
        "lora": {
          "bandwidth": 125000,
          "spreading_factor": 12
        }
      },
      "rx2_frequency": "869525000",
      "priority": "HIGHEST",
      "frequency_plan_id": "EU_863_870_TTN"
    },
    "correlation_ids": [
      "gs:conn:01FR4DY1W1SXBKY7ZF82X7Q4NS",
      "gs:up:host:01FR4DY1WD3MTEFDRAQM930VW9",
      "gs:uplink:01FR5S985YMNA1Y9WMS8FN4ZRS",
      "ns:downlink:01FR5S99YFG9Q7W9TADS3C9PXX",
      "ns:uplink:01FR5S9861TP2HAS839HXSGV9A",
      "rpc:/ttn.lorawan.v3.GsNs/HandleUplink:01FR5S98614JX1YFJ8THWNNGGQ",
      "gs:conn:01FR4DY1W1SXBKY7ZF82X7Q4NS",
      "rpc:/ttn.lorawan.v3.NsGs/ScheduleDownlink:01FR5S99YFKY65X06DRC0HD8WX"
    ]
  },
  "correlation_ids": [
    "gs:conn:01FR4DY1W1SXBKY7ZF82X7Q4NS",
    "rpc:/ttn.lorawan.v3.NsGs/ScheduleDownlink:01FR5S99YFKY65X06DRC0HD8WX"
  ],
  "origin": "ip-10-100-15-245.eu-west-1.compute.internal",
  "context": {
    "tenant-id": "CgN0dG4="
  },
  "visibility": {
    "rights": [
      "RIGHT_GATEWAY_TRAFFIC_READ",
      "RIGHT_GATEWAY_TRAFFIC_READ"
    ]
  },
  "unique_id": "01FR5S99YF21NSVTFEN9Y0SHXD"
}

Application Console Event Detail for the downlink


  "name": "ns.down.data.schedule.attempt",
  "time": "2021-12-30T13:43:22.526830168Z",
  "identifiers": [
    {
      "device_ids": {
        "device_id": "mcci-sonar-otaa",
        "application_ids": {
          "application_id": "sonar-hcsr04"
        }
      }
    },
    {
      "device_ids": {
        "device_id": "mcci-sonar-otaa",
        "application_ids": {
          "application_id": "sonar-hcsr04"
        },
        "dev_eui": "70B3D57ED004AA39",
        "join_eui": "0000000000000000",
        "dev_addr": "260B674B"
      }
    }
  ],
  "data": {
    "@type": "type.googleapis.com/ttn.lorawan.v3.DownlinkMessage",
    "raw_payload": "YEtnCyaBAAAGhYjJfg==",
    "payload": {
      "m_hdr": {
        "m_type": "UNCONFIRMED_DOWN"
      },
      "mic": "hYjJfg==",
      "mac_payload": {
        "f_hdr": {
          "dev_addr": "260B674B",
          "f_ctrl": {
            "adr": true
          },
          "f_opts": "Bg=="
        }
      }
    },
    "request": {
      "downlink_paths": [
        {
          "uplink_token": "CiIKIAoUZXVpLTU4YTBjYmZmZmU4MDBmNDESCFigy//+gA9BEJOt6qwJGgsI+u62jgYQtJH6NSC43PCehqsKKgsI+u62jgYQ19H6BA=="
        }
      ],
      "rx1_delay": 5,
      "rx1_data_rate": {
        "lora": {
          "bandwidth": 125000,
          "spreading_factor": 7
        }
      },
      "rx1_frequency": "868100000",
      "rx2_data_rate": {
        "lora": {
          "bandwidth": 125000,
          "spreading_factor": 9
        }
      },
      "rx2_frequency": "869525000",
      "priority": "HIGHEST",
      "frequency_plan_id": "EU_863_870_TTN"
    },
    "correlation_ids": [
      "gs:conn:01FR4DY1W1SXBKY7ZF82X7Q4NS",
      "gs:up:host:01FR4DY1WD3MTEFDRAQM930VW9",
      "gs:uplink:01FR5S9D819W581TJEYVE5A9EN",
      "ns:downlink:01FR5S9DMYPJ5TA1A6PNVNYWJA",
      "ns:uplink:01FR5S9D83W6GWJ7MCSTYN2HPT",
      "rpc:/ttn.lorawan.v3.GsNs/HandleUplink:01FR5S9D83ZFTQS2ZXN1HSPHSQ"
    ]
  },
  "correlation_ids": [
    "gs:conn:01FR4DY1W1SXBKY7ZF82X7Q4NS",
    "gs:up:host:01FR4DY1WD3MTEFDRAQM930VW9",
    "gs:uplink:01FR5S9D819W581TJEYVE5A9EN",
    "ns:downlink:01FR5S9DMYPJ5TA1A6PNVNYWJA",
    "ns:uplink:01FR5S9D83W6GWJ7MCSTYN2HPT",
    "rpc:/ttn.lorawan.v3.GsNs/HandleUplink:01FR5S9D83ZFTQS2ZXN1HSPHSQ"
  ],
  "origin": "ip-10-100-12-30.eu-west-1.compute.internal",
  "context": {
    "tenant-id": "CgN0dG4="
  },
  "visibility": {
    "rights": [
      "RIGHT_APPLICATION_TRAFFIC_READ",
      "RIGHT_APPLICATION_TRAFFIC_READ"
    ]
  },
  "unique_id": "01FR5S9DMYP55Q6FYGP383K1GN"
}

That “downlink”

is your join accept.

Probably run out of memory aa stack overflow so overwritten some key data if you haven’t turned off Class B and other bits.

In the end device General settings/Network layer/Advanced MAC settings
If I set the “Status count periodicity” and the “Status time periodicity” to zero the node is sending Fcnt 19 uplink messages before a downlink message stops the uplink transmissions.

When I do that then there is no downlink message directly after the Join.

I am using the documented settings of the manually registered end device with the

  • recommended Europe 863-870Mhz (RF9 for RX2)
  • MAC V1.0.2
  • PHY V1.0.2 REV B

This is my first TTS V3 node so any setting could be wrong!

Any suggestions?

That “triggering” downlink is the one we need to see the raw packet (or else broken out MAC command contents) of.

What you share before was just the (subsequent?) join accept downlink.

Answer my question? Particularly as it will speak to your review of the instructions which will then lead to the choice of LoRaWAN version as well.

The status periodicity, which you already mentioned, would cut in after 200 uplinks or one day - so if you are bench testing with a 5 minute uplink schedule for instance, it’s irrelevant.